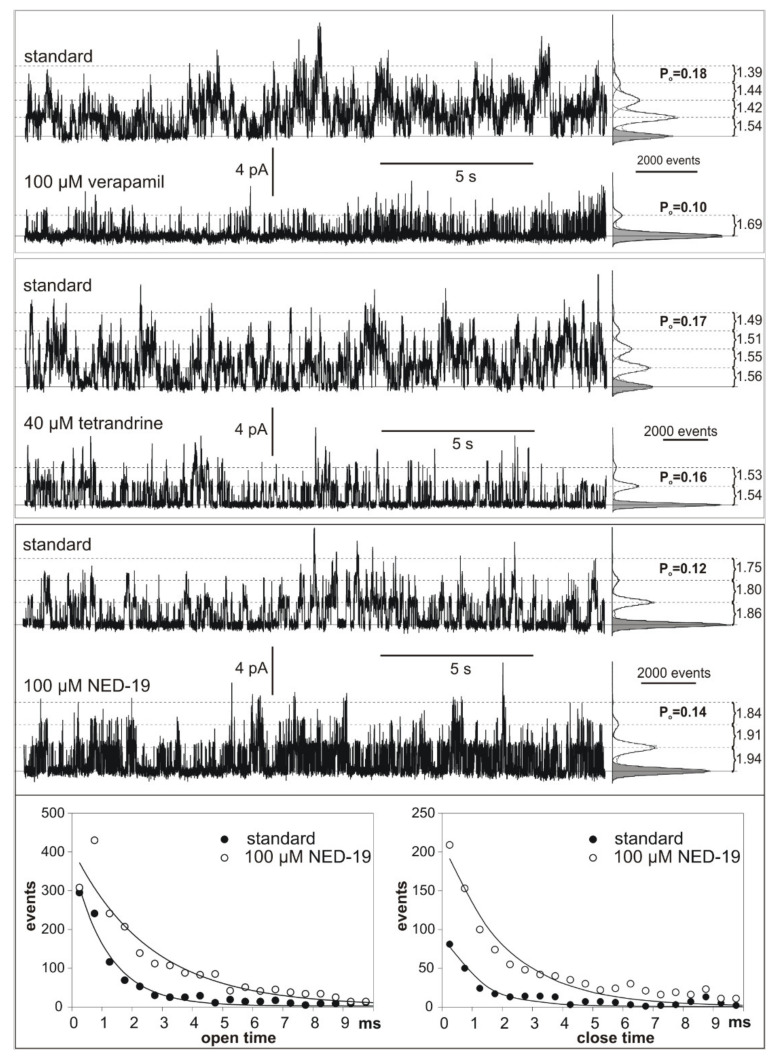
Figure 5.
Comparison of SV/TPC channel activity recorded after the application of 100 µM verapamil, 40 µM tetrandrine, and 100 µM NED-19. The traces were obtained at 60 mV. The solid line and grey histograms indicate the closed state, and the dashed line and white histograms indicate open states. Amplitudes of the currents flowing through the single channels and open probabilities (Po) obtained from the histograms are indicated. The measurements were prepared in the cytoplasm-out configuration.

