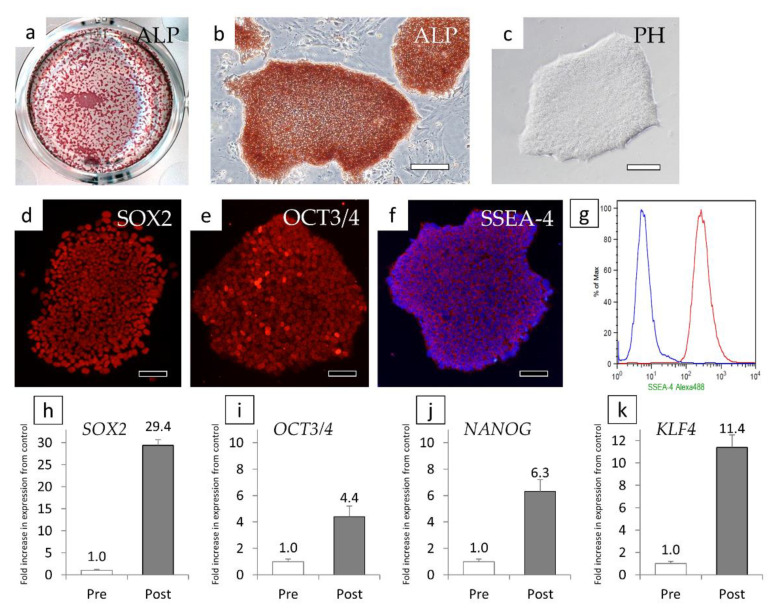
Figure 3.
Verification of H-iris iPS cells. (a) Low magnification of an ALP-stained multiplate. (b) ALP staining of aggregated cell colonies. (c) The morphology of cloned colonies observed with a phase contrast microscope. (a–f) Fluorescent immunostaining of cloned colonies for (d) SOX2, (e) OCT3/4, and (f) SSEA-4. (g) Analysis of SSEA-4 by FCM. The blue line represents the histogram of negative cells. (h–k) Relative semi-quantitative analysis of gene expression of (h) SOX2, (i) OCT3/4, (j) NANOG, and (k) KLF4. Pre: iris tissue stem/progenitor cells before gene transfer, Post: cells of cloned colonies (Post). Bars: 100 μm.

