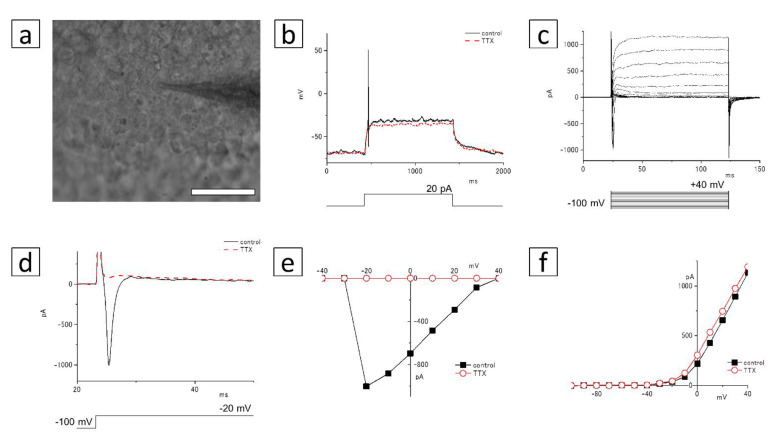
Figure 10.
Patch-clamp recording of the Neurofilament-M- and Brn-3b-positive cells in the cell cluster. (a) A micrograph of the cultured cells. The patch electrode approaches the soma of the cell from the right side. Bar: 50 µm. (b) Responses to a depolarization induced by an injection of 20 pA current, recorded in control Ringer’s solution (thin line), and with the addition of 1 µM TTX (dotted line). (c) Membrane currents of the cultured cells by depolarizing voltage steps from a holding potential of –100 mV. Command voltages were increased in 10 mV steps from −100 mV to +40 mV. (d) Command voltages were increased to −20 mV in control solution (thin line) or 1 µM TTX (dotted line). The inward current at the beginning of the voltage-step was blocked by TTX. (e) The I–V relationship of voltage-gated inward currents. The peak inward currents in control solution (filled squares) or in 1 μM TTX (open circles) were plotted against the test-pulse voltage. (f) The I–V relationship of voltage-gated outward currents. The amplitudes of outward currents in control solution (filled squares) or in 1 μM TTX (open circles) were plotted against the test-pulse voltage.

