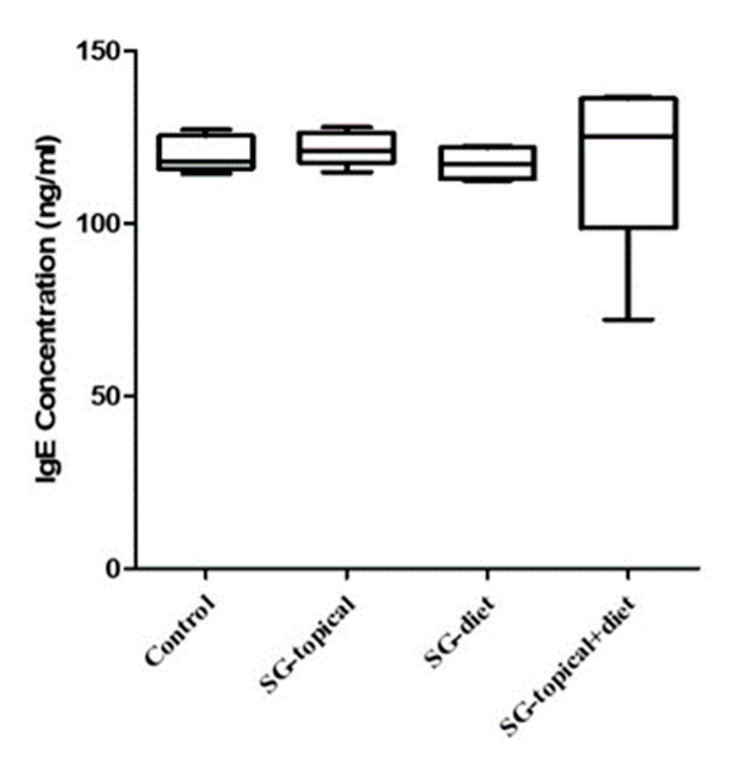
Figure 2.
Comparison of the serum IgE concentrations between the groups. The serum IgE concentrations are expressed as the optic density units. The serum IgE concentrations were similar in all the groups. Control; positive control group, SG-topical; Synbio-glucan topical treatment group, SG-diet; Synbio-glucan dietary treatment group, SG-topical + diet; Synbio-glucan topical + dietary treatment group.

