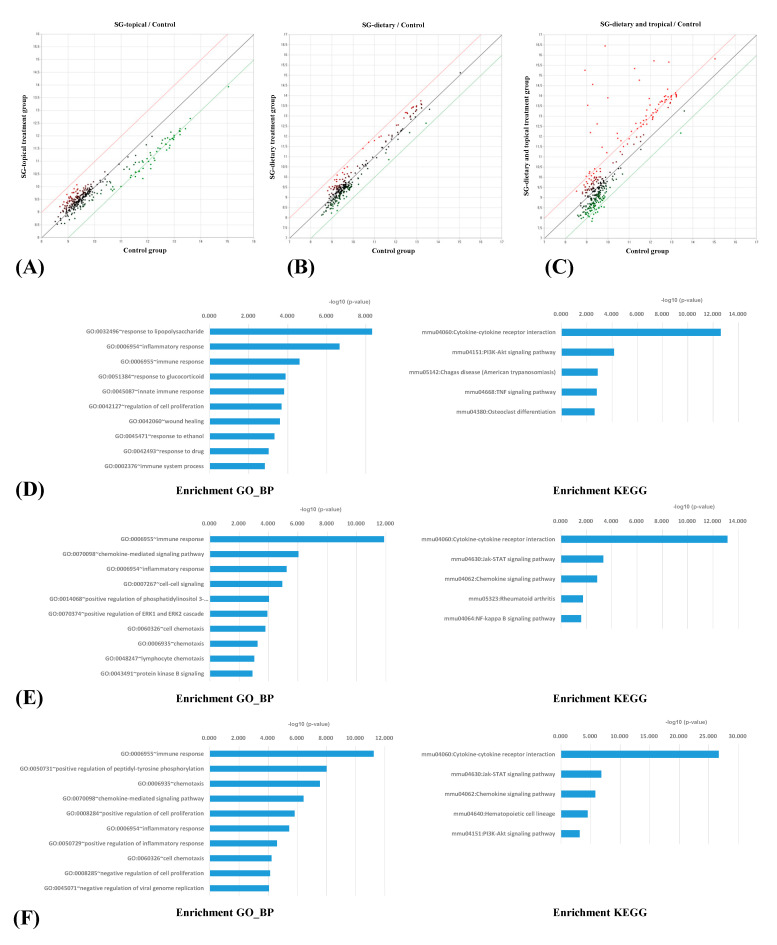
Figure 3.
(A) Changes in signal between the Synbio-glucan topical treatment group and the positive control group, (B) Synbio-glucan dietary treatment group and the positive control group, and between (C) the Synbio-glucan topical + dietary treatment group and the positive control group. The red and green lines indicate two-fold up- or downregulated expression, respectively. This scatter plot shows the pattern of changes in the serum cytokines between the treatment groups and the positive control group. (D) Functional analysis of the antibody array results after the Synbio-glucan topical treatment. The most enriched GO_BP term was the response to lipopolysaccharide and the most enriched KEGG categories were the cytokine–cytokine receptor interactions. (E) Functional analysis of the antibody array results after the Synbio-glucan dietary treatment. The most enriched GO_BP term was the immune responses and the most enriched KEGG categories were the cytokine–cytokine receptor interactions. (F) Functional analysis of the antibody array results after the Synbio-glucan topical + dietary treatment. The most enriched GO_BP term was the immune responses, and the most enriched KEGG categories were the cytokine–cytokine receptor interactions.

