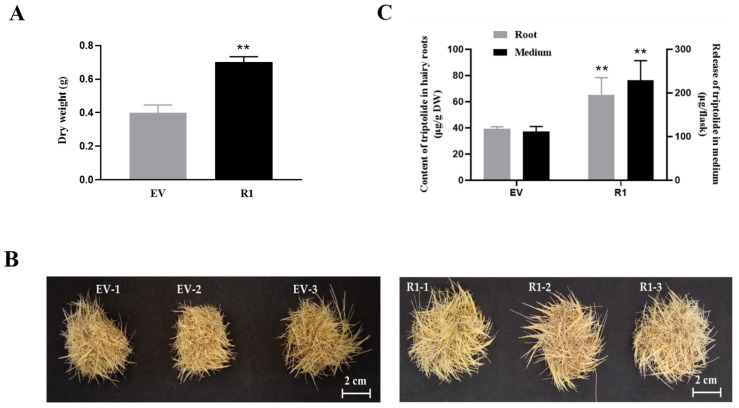
Figure 5.
The biomass, phenotypes, and the production of triptolide in the control (EV) and TwMYC2a/b RNAi (R1) hairy roots lines. (A) The dry weight of the control (EV) and R1 hairy roots. (B) Phenotypes of the control (EV) and R1 hairy roots. Scale bars are 2 cm. (C) Triptolide content in hairy roots and the release content of triptolide in the medium in the control (EV) and R1. DW, dry weight. All the hairy roots were obtained after being cultured for 28 d. All data presented here are means ± SD of three biological replicates. Statistical significance was determined by Student’s t-test (** p < 0.01). These assays were repeated three times with similar results.

