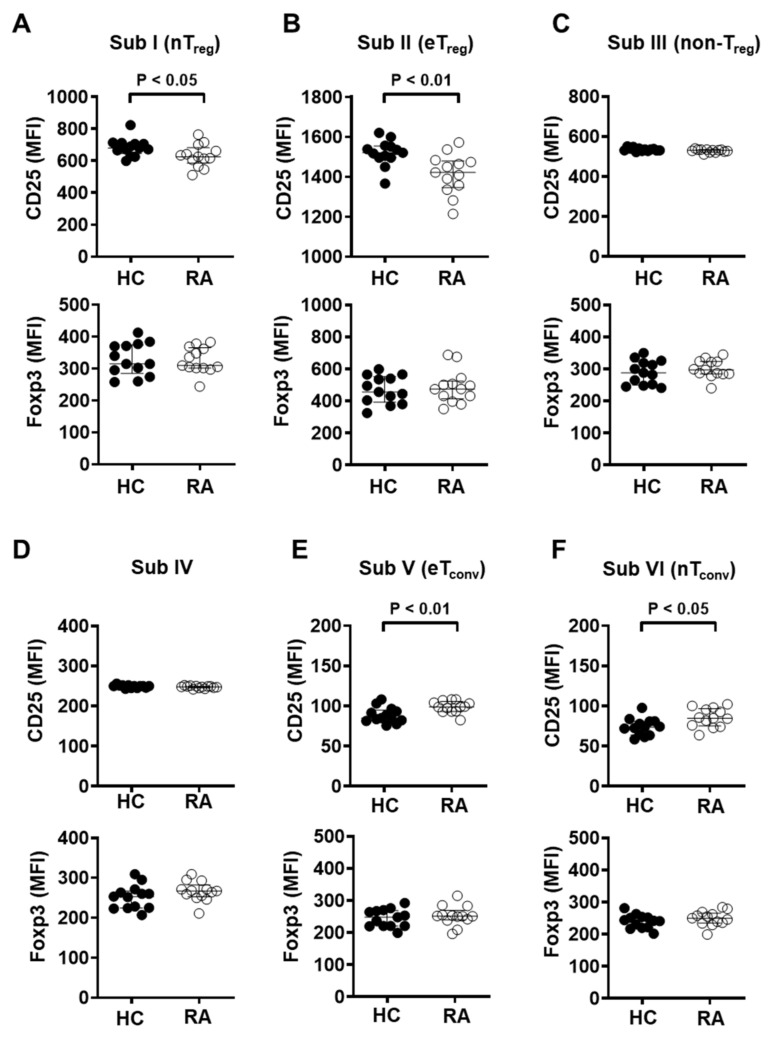
Figure 4.
Naïve and effector Treg subpopulations from RA patients showed significantly reduced CD25 expression. Expression of CD25 and Foxp3 was measured by flow cytometry in each CD4+ T cell subgroup from healthy controls (HC, n = 13) and RA patients (RA, n = 13). Subgroups were as follows: (A) I (CD25intCD45RA+ cells), (B) II (CD25hiCD45RA− cells), (C) III (CD25intCD45RA− cells), (D) IV (CD25lowCD45RA− cells), (E) V (CD25−CD45RA− cells), and (F) VI (CD25−CD45RA− cells). Statistical differences were calculated by Mann–Whitney test.

