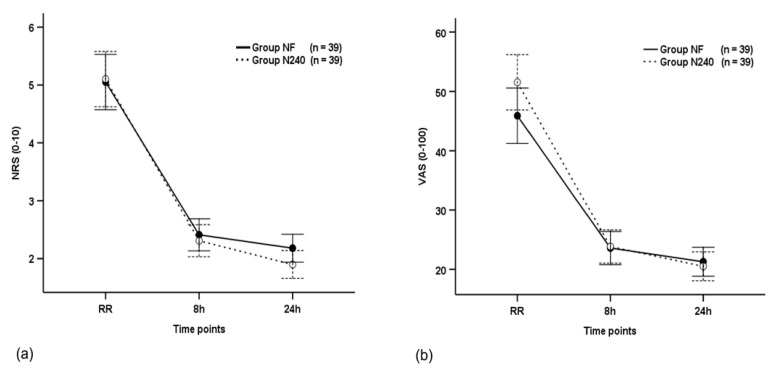
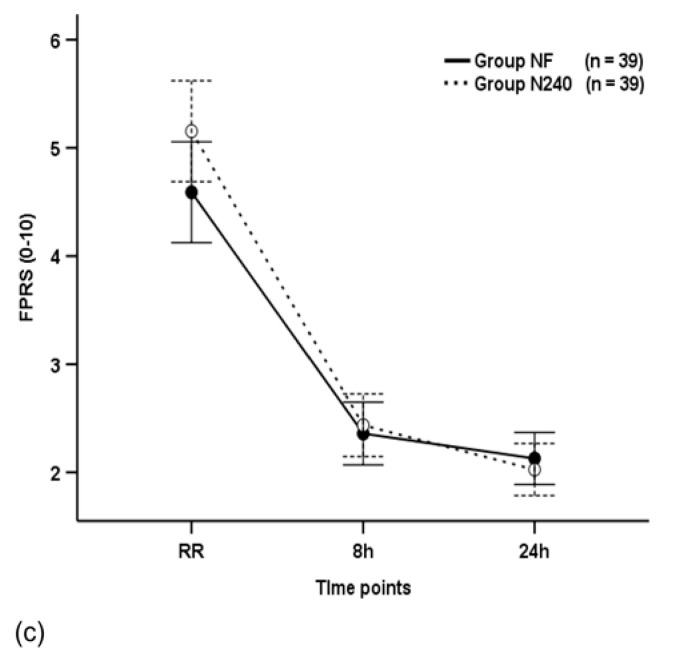
Figure 2.
Time-sequential changes in numeric rating scale (NRS) scores (a), visual analogue scale (VAS) scores (b), and Faces Pain Ratings Scale (FPRS) scores (c). Data points and error bars represent means and 95% confidence intervals, respectively. Group NF, group receiving nefopam-fentanyl polytherapy; Group N240, group receiving nefopam monotherapy; RR, 30 min after admission to the recovery room.


