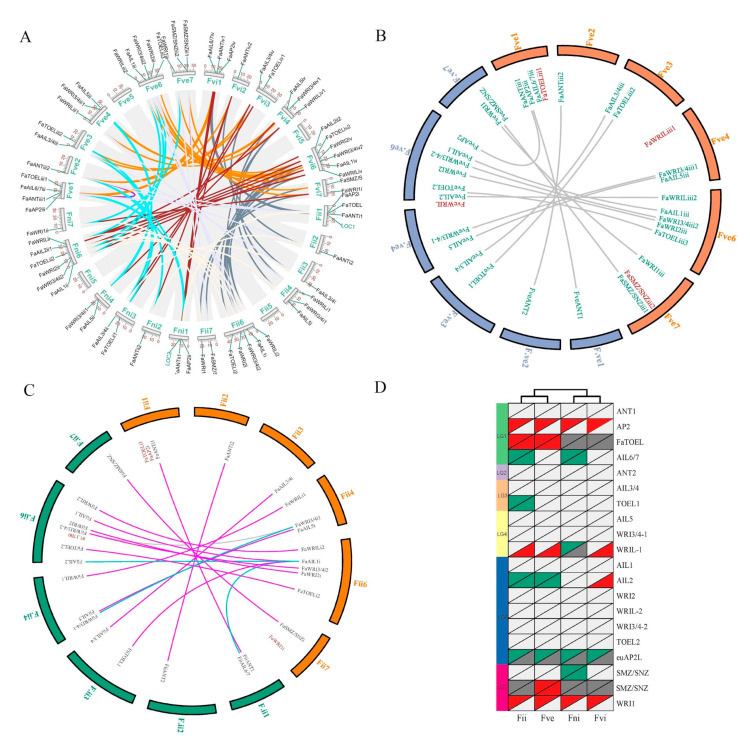
Figure 3.
The intra-species and inter-species synteny analysis of the Fragaria × ananassa genome with sub-genome donors. (A) The intra-species synteny analysis. Syntenic regions are indicated by dark lines, and paralogous AP2 pairs are highlighted. The 4 sub-genomes are named Fve, Fii, Fni, and Fvi according to sub-genome donors [2]. The 1–7 chromosomes of each sub-genome are arranged in order of the Fni, Fve, Fvi, and Fii sub-genomes. The locations of AP2 genes are mapped by the scale plate value of the chromosomal length. Two green labeled homologous genes, LOC1 and LOC2, were rejected as AP2 TFs due to a lack of the AP2 domain. (B) Synteny analysis of the Fve sub-genome of F. × ananassa with orange color between the Fragaria vesca genome whose chromosomes were named F.ve1–7. The orthologous AP2 pairs are indicated by lines, and unpaired AP2 TFs are red-labeled. (C) Synteny analysis of the Fii sub-genome of F. × ananassa with orange color between the Fragaria iinumae genome whose chromosomes were named F.ii1–7. The orthologous AP2 pairs are indicated by lines, and unpaired AP2 TFs are red-labeled. The pair lines supported/unsupported by phylogenetic analysis (Figure S3 and S4) are highlighted with purplish red and blue colors, respectively. (D) Deductive gene duplication and loss. Gene loci are listed in 20 rows, and sub-genomes are listed in 4 columns. Red, blue, light gray, and dark gray triangles of the top left indicate gene duplication, gene loss, present shared locus, and absent shared locus compared with F. iinumae AP2 loci, respectively. Low right triangles indicate an F. vesca AP2 loci reference.

