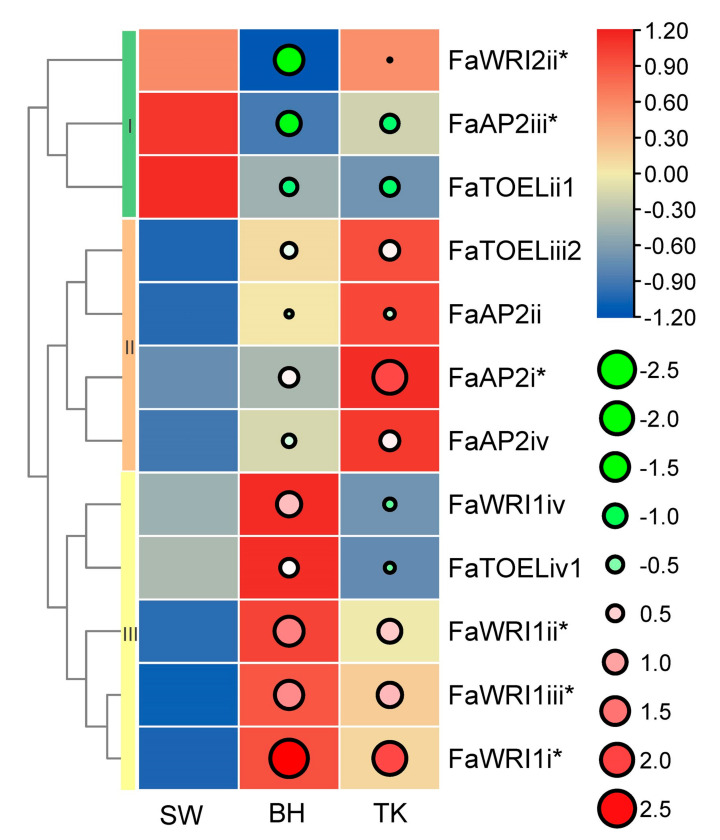
Figure 4.
Expression profile of AP2 genes in three strawberry cultivars. AP2 genes are listed in rows, and the ‘Benihoppe,’ ‘Tokun,’ and ‘Snow White’ cultivars (SW, BH, and TK, respectively) are listed in columns. Normalized TPM (transcripts per kilobase of exon model per million mapped reads) are indicated by the gradient color of rectangles, and three row clusters are indicated by I, II, and III. Log2(fold-change) values using SW as a control sample are indicated by circle size and gradient color. * indicates significantly differentially expressed genes.

