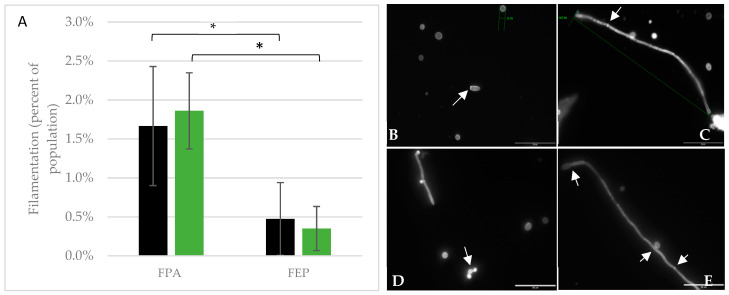
Figure 5.
Quantification of yeast filamentous cell morphology. Aliquots from each growth condition in the three payloads were fixed and retained at 4 °C for microscopic analyses. Some samples were fixed in microgravity, but for those samples returned frozen or viable, the aliquot was fixed immediately upon sample return to the home laboratory. (A) Filaments were quantified as a percentage of the total population. In this analysis, samples were aggregated by hardware, thus the FPA data represents samples cultured in YPD from the Micro-6 and Micro-14/FPA payloads. Similarly, the FEP data represents the aggregate from samples cultured in YPD in Large FEP bags and Small FEP bags from the Micro-14/FEP payload. * p < 0.003 for FPA vs. FEP. (B–E) Calcofluor White stained cells were visualized to evaluate cell morphology from Micro-14/FPA, scale bar = 35 μm; (B,C) are from terrestrial control samples and (D,E) are from flight samples. The arrows highlight key features in each of the images, including, (B) a cell with a bud scar, as indicated by a cell surface region with higher intensity staining and a second cell with a caliper measurement of 5.1 μm, (C) a caliper measured filament (142 μm) in which higher intensity staining also indicates intercellular septa (arrow), (D) cells in the process of budding (arrow), and (E) long filamentous cell demarcated with narrowed septal junctions (top arrow), a cell budding from the filament (middle arrow), and increased staining at septal junctions (bottom arrow).

