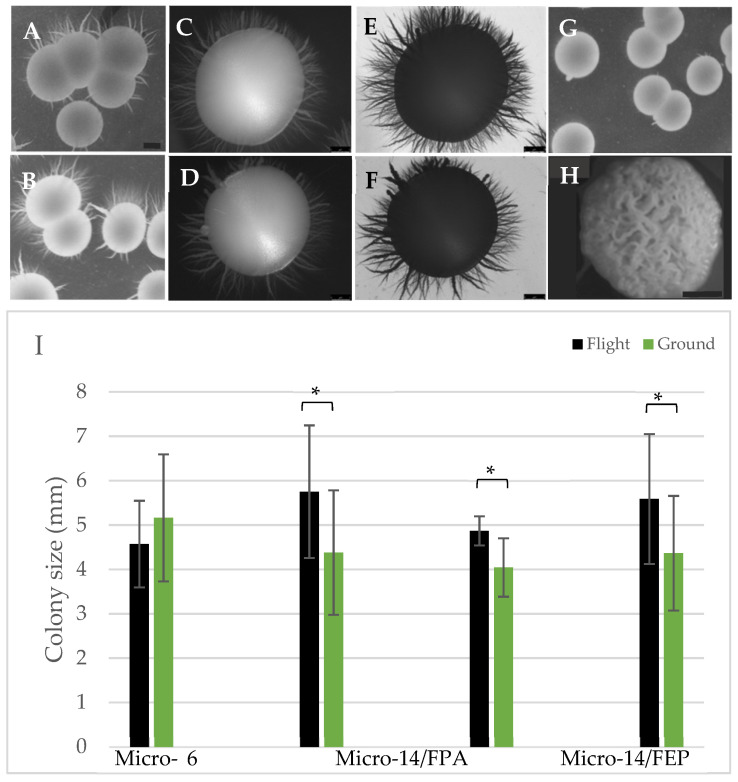
Figure 7.
Colony morphology and size evaluated in yeast samples returned live. Following each mission, cells were isolated immediately following hardware de-integration, counted, diluted, and spread on YPD agar plates. Following 3 days of growth at 30 °C the plates were transferred to 4 °C pending analysis. (A–H) Individual colonies were imaged to evaluate colony architecture. (A,C,E,G) represent flight samples; (B,D,F) represent terrestrial controls; H represents the HIW colonies produced after cultivation in the ground-based HARV bioreactor. Specifically, colonies are associated with the following payloads (A,B) Micro-6; (C,D) Micro 14/FPA, view of top of colony; (E,F) Micro 14/FPA, view of bottom of colony; (G) Micro-14/FEP and (H) HIW colony from HARV bioreactor as a morphology reference. Scale bars in panels (A,B) = 2.25 mm, (C–F) = 1 mm, (G,H) = 2 mm. (I) The diameter was measured on each of 15 colonies per plate for each payload. An aggregate of the data from all payloads was pooled and indicated as ‘All’. Black bars = flight; green bars = terrestrial controls. * p < 0.001, flight vs. terrestrial.

