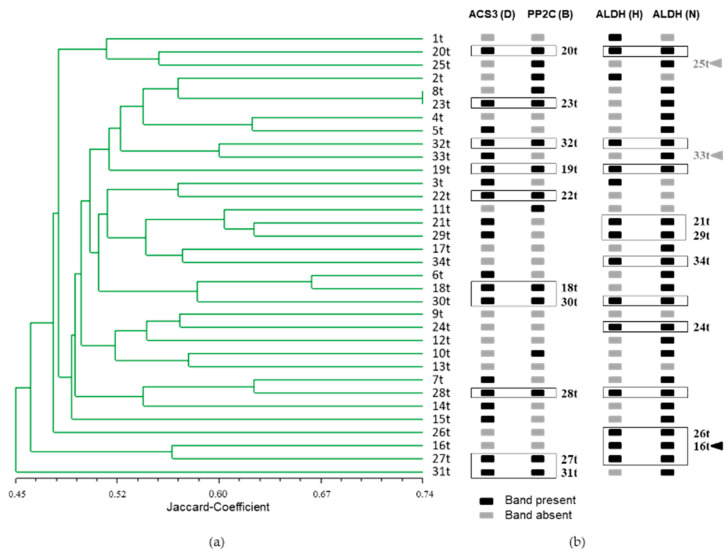
Figure 6.
Clustering of the 34 potato varieties based on the genetic similarity obtained by SSR analyses and selection with SSR markers. (a) UPGMA dendrogram of the 34 potato varieties (1t = most drought tolerant, 34t = most sensitive) based on all 75 SSR primer combinations derived from candidate genes for drought tolerance, Mantel coefficient r = 0.62; (b) Selection by applying four SSR markers associated with drought sensitivity. Black box= band is present, grey box= band is absent. The varieties are ordered according to the UPGMA dendrogram. Boxed varieties are selected by the presence of two marker bands either in the combination HRO_ACS3_D and HRO_PP2C_1_B or the combination HRO_ALDH_H and HRO-ALDH_N. Black Arrow head = falsely negative selected; Grey arrow head = falsely positive selected.

