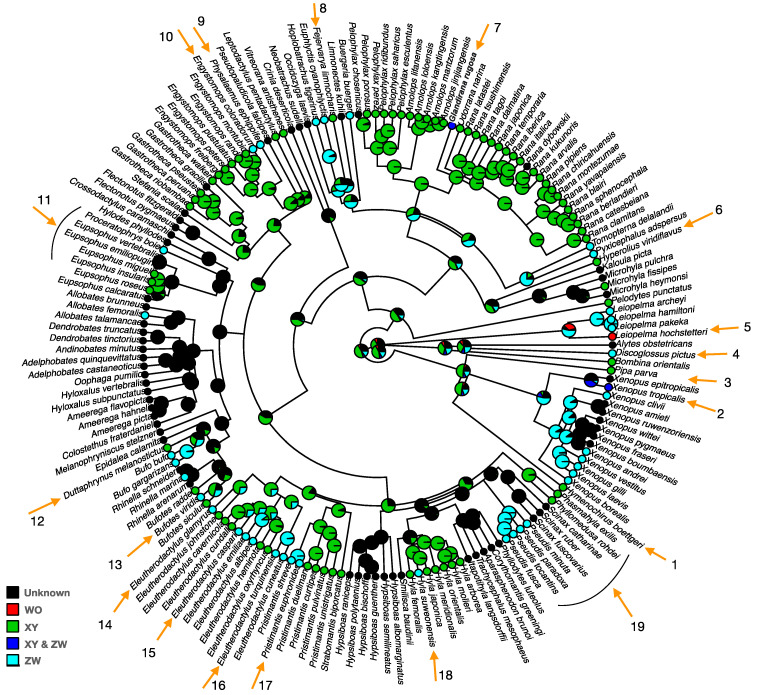
Figure 2.
Distribution of various sex-determination systems along Anurans. The phylogenetic tree is obtained from http://www.timetree.org/, accessed on 5 February 2021 and the pattern of sex chromosome diversity and the ancestral status reconstruction were analyzed and visualized with the “Phytools” package in R (version 3.6.3), using a stochastic mapping approach with the ARD (all rates different matrix) transition rate model for discrete character traits [48,49]. Pie charts display the posterior probability of sex-determination systems on each node of the phylogenetic tree. Numbered arrows indicate transitions between sex-determination systems.

