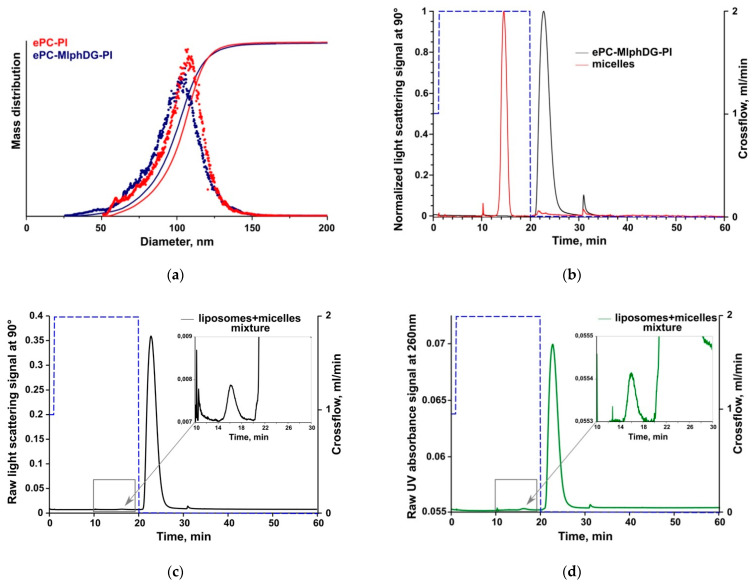
Figure 8.
AF4/MALS liposome size distribution (a). AF4/MALS elution profile of micelles and ePC–MlphDG–PI liposomes injected separately (b) and in mixture ((c,d) respectively) where the dotted lines show the crossflow conditions. In (b,c), the light scattering signals at 90° are shown, in (d), the variable wavelength detector (VWD) signal at 260 nm. The first 10 min of analysis is focusing and sample injection.

