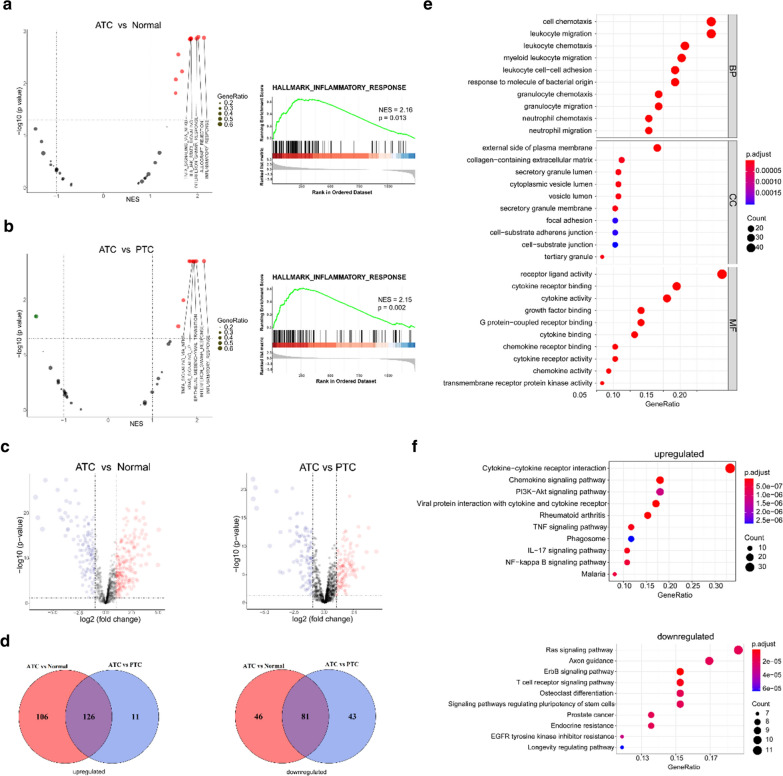
Fig. 3.
Exploration of the function of IRGs in ATCs, PTCs and normal tissues. a, b GSEA of IRGs showed the top 5 activated pathways (left panels) in ATCs compared with normal tissues (a) and PTCs (b); the inflammatory response (right panels) was the most enriched. c Volcano plots of differentially expressed IRGs between ATCs and normal tissues (left panel) or PTCs (right panel). d Venn diagram showing the consistently deregulated genes between ATCs and PTCs or normal tissues in the GSE33630 cohort. e, f GO (e) and KEGG (f) enrichment analyses of 207 commonly deregulated IRGs

