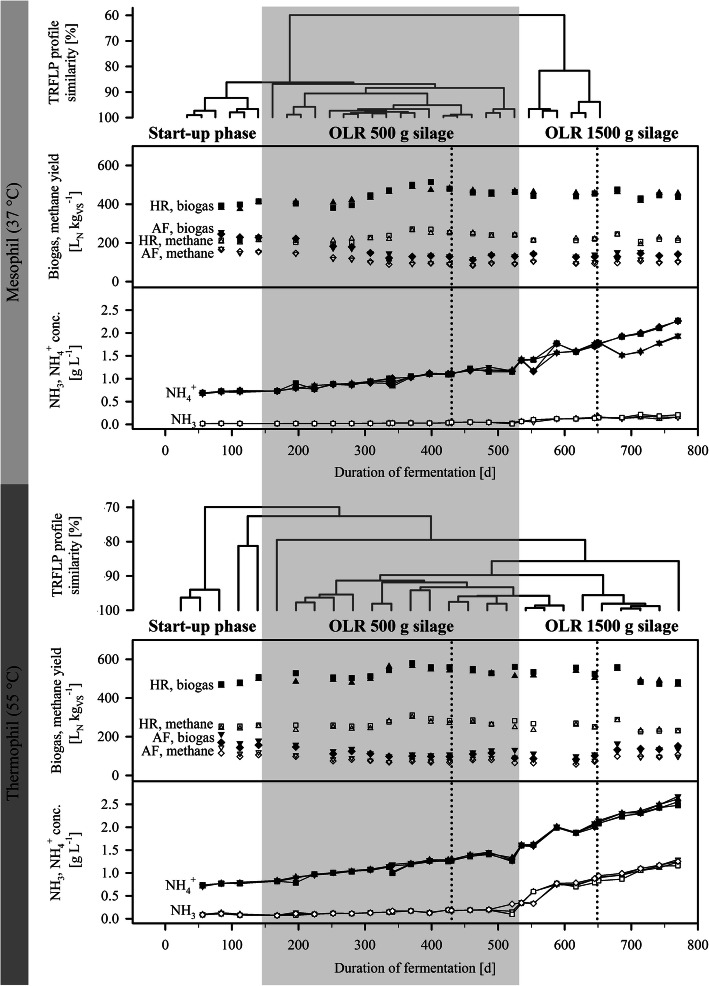
Fig. 2.
Biogas and methane yields, and NH4+- and NH3-contents in the biogas reactor effluents. Bacterial 16S rRNA gene targeting TRFLP analyses results are shown exemplary for different time points at different process conditions. Dotted lines indicate time points of sampling for NGS. ▲,△, hydrolysis reactor (HR) of reactor system M1 (mesophil) resp. T1 (thermophil);▼, ▽, downstream AF of reactor system M1 (mesophil) resp. T1 (thermophil); ■, □, HR of reactor system M2 (mesophil) resp. T2 (thermophil); ◆, ◇, AF of reactor system M2 (mesophil) resp. T2 (thermophil); LN, liters normalized to 0 °C and 1013 hPa; VS, volatile substances; OLR, organic loading rate

