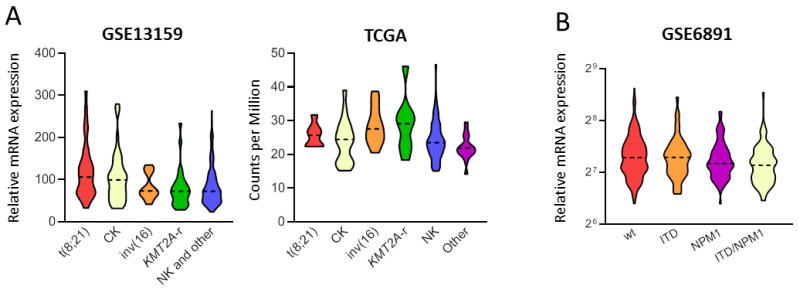
Figure 1.
PPM1D expression in AML according to cytogenetic classification and FLT3-ITD/NPM1 status. (A) Violin plot of PPM1D transcript level in the GSE13159 and TCGA cohorts showing a significant different distribution among cytogenetic subgroups (t(8;21); CK: complex karyotype; inv(16): inv(16)/t(16;16); KMT2A-r: KMT2A-rearranged; NK: normal karyotype; AML carrying NK and other cytogenetics abnormalities could not be distinguished in GSE13159 due to data unavailability, thus named as “NK and other”). (B) Violin plot of PPM1D transcript level in the GSE6891 cohort showing a significant different distribution among molecular subgroups defined by FLT3-ITD and NPM1 mutations (wt: FLT3-ITD−/NPM1-wt; ITD: FLT3-ITD+/NPM1-wt; NPM1: FLT3-ITD−/NPM1-mut; ITD/NPM1: FLT3-ITD+/NPM1-mut). The plots represent the frequency distribution of PPM1D levels (from minimum to maximum) and the dotted line indicates the median value (only cohorts showing statistically significant results are reported in the figure).

