Figure 3.
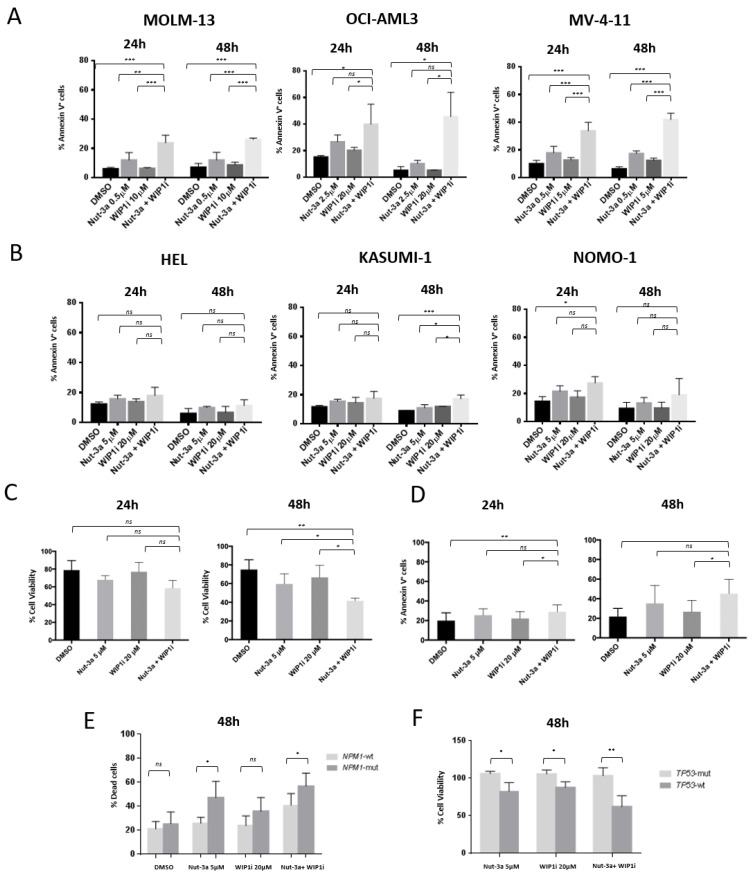
Apoptotic response of AML cell lines and primary cells to combined Nut-3a and WIP1i treatment. (A) Histograms showing the percentage of apoptotic (AnnexinV+ cells) cells in TP53-wt (A) and TP53-mut cell lines (B) after 24 and 48 h treatment with single and combined Nut-3a and WIP1i. Average value and standard deviation of 3 independent experiments are shown. (C) Cell viability and (D) apoptotic response of TP53-wt AML primary cells (n = 3 and n = 6, respectively) after 24 h and 48 h treatment with single and combined Nut-3a and WIP1i treatments. (E) Histograms showing the percentage of dead cells in NPM1-mut and NPM1-wt primary AML cells (n = 5 each) after 48 h treatment with single and combined Nut-3a and WIP1i. (F) Histograms showing the percentage of viable cells (normalized on vehicle-treated cells) in TP53-mut (n = 3) and TP53-wt (n = 4) primary AML cells after 48 h treatment with single and combined Nut-3a and WIP1i (* p < 0.05, ** p < 0.01, *** p < 0.001, ns: not significant).

