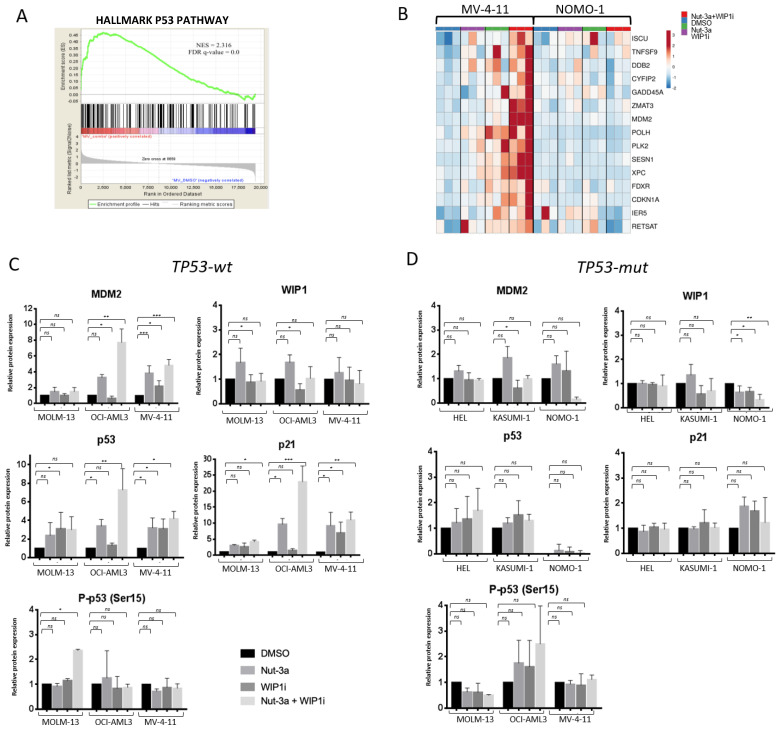
Figure 4.
Changes in the expression of p53-related genes induced by the treatment in TP53-wt and TP53-mut cells. Cells were harvested after 16 h of treatment (Nut-3a 0.5 and 5 µM; WIP1i 5 and 20 µM, for TP53-wt and TP53-mut cells, respectively) both for gene expression microarray and protein analyses. (A) Enrichment of p53 signature in MV-4-11 cells treated with the drug combination vs. vehicle (gene expression microarray). (B) Heatmap of MV-4-11 and NOMO-1 cells showing the significantly deregulated genes (differential expression analysis between Nut-3a+WIP1i-treated and vehicle-treated MV-4-11 cells, fold change ≥ 2, p < 0.05) belonging to the p53 signature in the analyzed models. (C) Protein quantification of p53-related genes in treated TP53-wt and (D) TP53-mut cells. Histograms show the average value of 3 independent experiments ± SD (* p < 0.05, ** p < 0.01, *** p < 0.001, ns: not significant).

