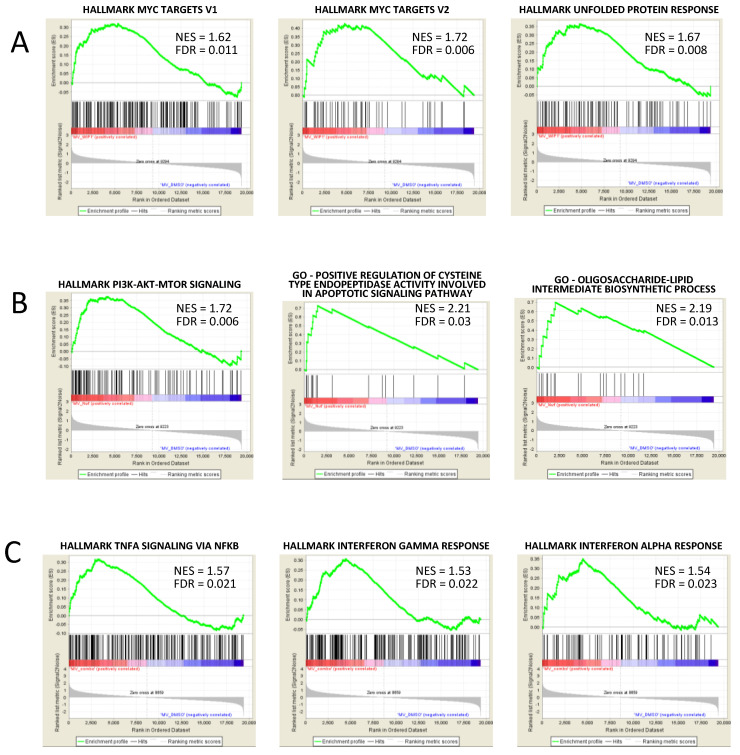
Figure 5.
Treatment-specific transcriptional signatures enriched in MV-4-11 and NOMO-1 cells. GSEA plots of significantly enriched signatures in MV-4-11 cells treated with (A) WIP1i, (B) Nut-3a, or (C) their combination vs. control cells (NES: normalized enrichment score, FDR: false discovery rate).

