Figure 3.
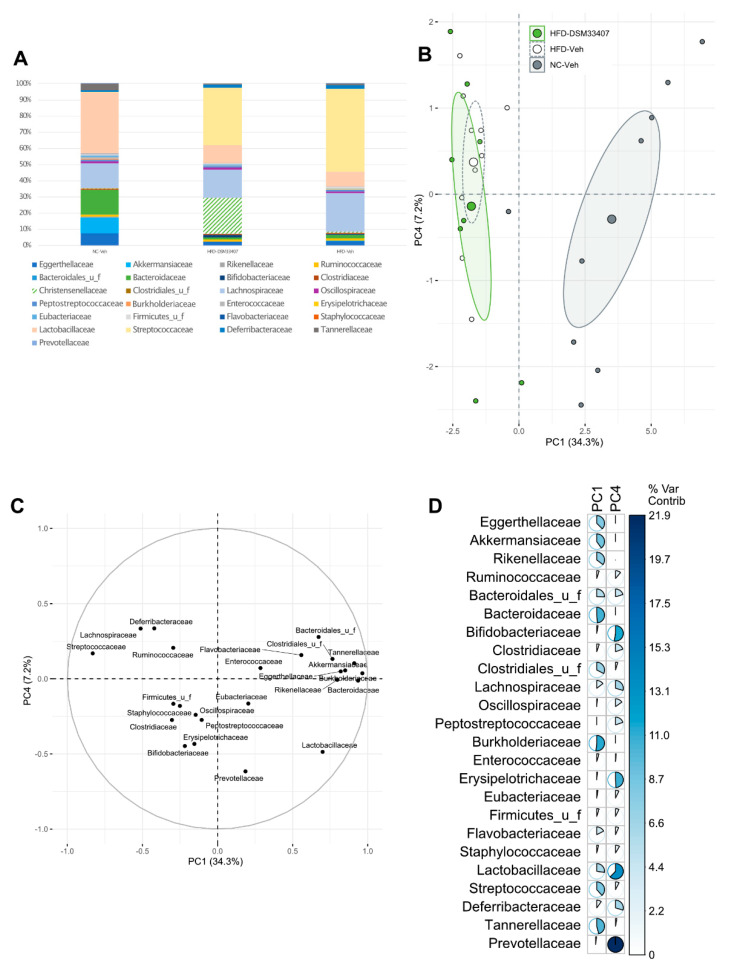
C. minuta DSM33407 modulated the fecal microbiome in a DIO mouse model assessed after 40 days of oral treatment (min n = 8). (A) Microbiome profile assessed using shotgun metagenomic profiling and displayed in a normalized stacked bar plot at the family level. (B) PCA analysis scores calculated from the dataset after removal of the Christensenellaceae family. The larger dot represents the group mean point surrounded by the 95% confidence ellipse. (C) PCA loadings plot and (D) associated variable contributions. The colored bar is scaled to the maximum percentage of contribution.

