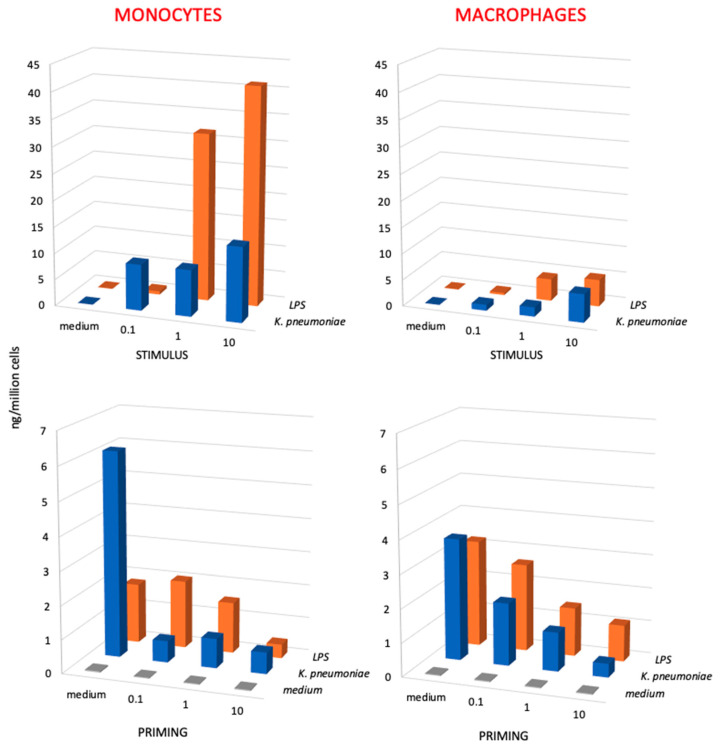
Figure 4.
Primary and secondary innate response of monocytes and macrophages to Klebsiella pneumoniae bacteria vs. K. pneumoniae LPS. The primary response (upper panels) of monocytes (left panels) and monocyte-derived macrophages (right panels) was measured in terms of TNFα production upon stimulation with increasing concentrations of killed K. pneumoniae bacteria (0.1, 1, and 10 bacteria per each monocyte/macrophage; blue columns) and to LPS from K. pneumoniae (0.1, 1, and 10 ng/106 monocytes/macrophages; orange columns). The secondary response (lower panels) of unprimed control cells (medium, in the horizontal axis; gray columns) and cells primed with increasing concentrations of K. pneumoniae bacteria (blue columns) or K. pneumoniae LPS (LPS; orange columns) was again measured in terms of TNFα production after a challenge of 24 h with the highest challenge concentration (10 bacteria per monocyte/macrophage; 10 ng LPS/106 monocytes/macrophages). Only homologous priming/challenge combinations are shown (in the depth axis). Results are the average of two to four replicates from two different donors. SD were <20% and are not shown. Statistical analysis is reported in the Supplementary Table S5.

