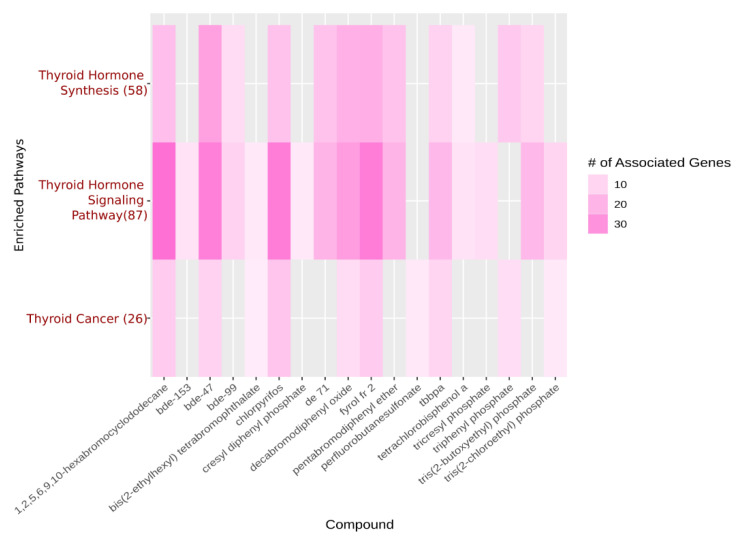
Figure 2.
A heatmap displaying a pathway enrichment analysis done on CTD using FRCs that were used in a high throughput screening experiment. Individual FRCs are plotted along the x-axis. The y-axis lists the pathways that are enriched for these chemicals, with the number in parentheses indicating the number of genes in each pathway that these chemicals (taken as a whole) are enriched in. Darker coloration represents increasing numbers of genes that are associated with each FRC.

