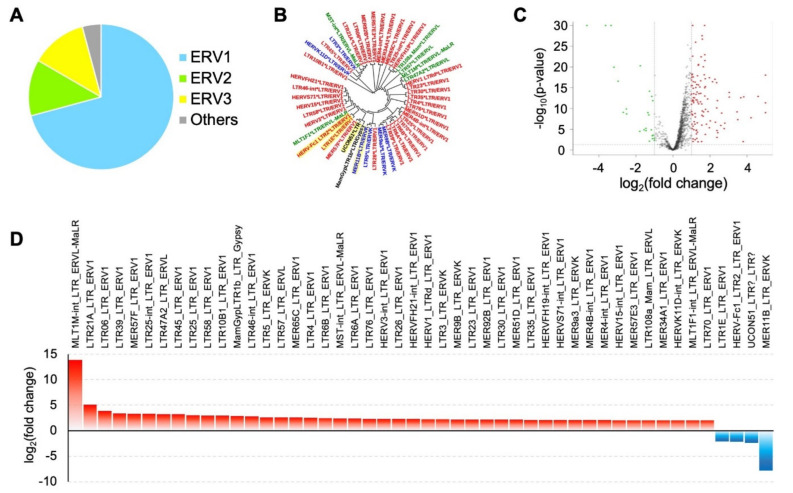
Figure 2.
Differential expression of repetitive elements in GBM and normal brain samples. (A) The major categories (ERV1, ERV2, ERV3, and others) of LTR elements differentially regulated in GBM and normal brain samples. (B) Phylogenetic analysis of the LTR elements differentially expressed in GBM. The phylogenetic tree was constructed by the maximum likelihood method with GTR + I + G and with a bootstrap value of 1000. Red: ERV1; blue: ERVK; green: ERVL; black: others. (C) The volcano plot for differentially expressed repetitive elements in GBM. The x-axis shows the fold change in the expression level of repetitive elements in GBM. The y-axis represents the significance (p-value). The significant (p-value < 0.05 and |fold change| ≥ 2) up (red) and down (green) elements as well as insignificant elements (black) are plotted. (D) The bar chart for LTR elements differentially expressed in GBM. The y-axis represents the fold change of upregulated (red) and downregulated (blue) elements in GBM.

