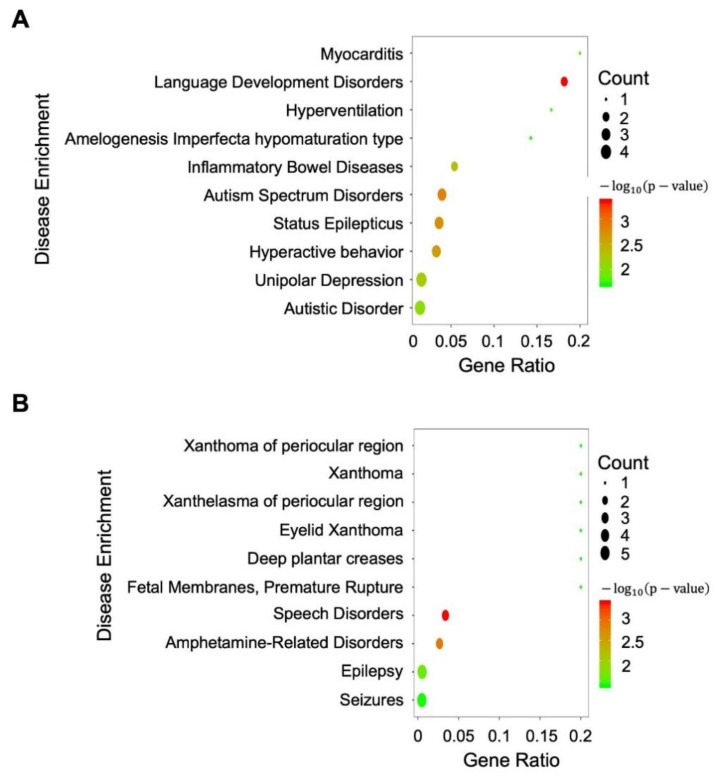
Figure 5.
The pathway enrichment analysis of differentially expressed neighboring genes near differentially expressed HERVs. (A) For genes neighboring MER11B_LTR_ERVK; (B) for genes neighboring LTR21A_LTR_ERV1. The size of the dot represents the number of differentially expressed genes that are related to the corresponding disease identified. The color of the dot represents the confidence (p-value) of the enrichment.

