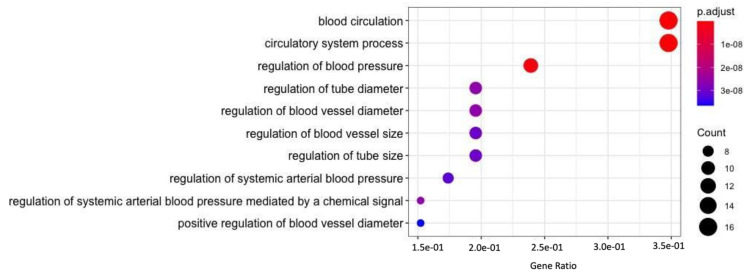
Figure 4.
The gene ontology analysis performed on all 53 prioritized HTN related genes to identify related biological processes. The gene ratio of participating genes in the enriched ontology, the color-coded Benjamini-Hochberg (BH)-adjusted p-value, and the number of genes (count) in each enriched ontology are shown in the above plot.

