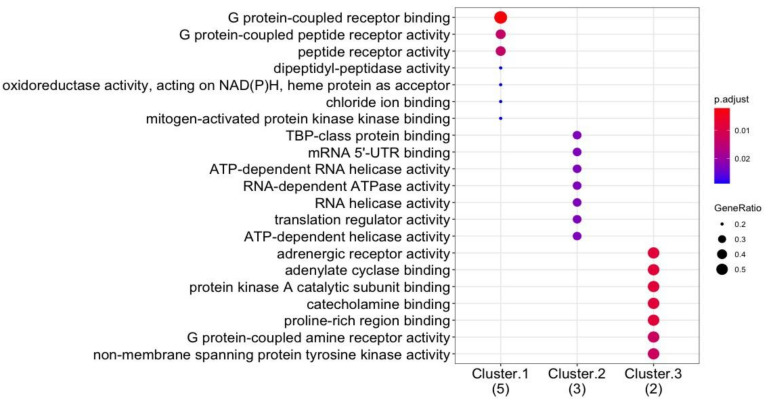
Figure 6.
GO enrichment (i.e., molecular function) performed on the co-expressed gene clusters (labelled cluster 1–3, and the number of genes in brackets) to relate molecular function to co-expressed genes. The gene ratio of participating genes in the enriched ontology, and the color coded BH-adjusted p-value are shown in the plot.

