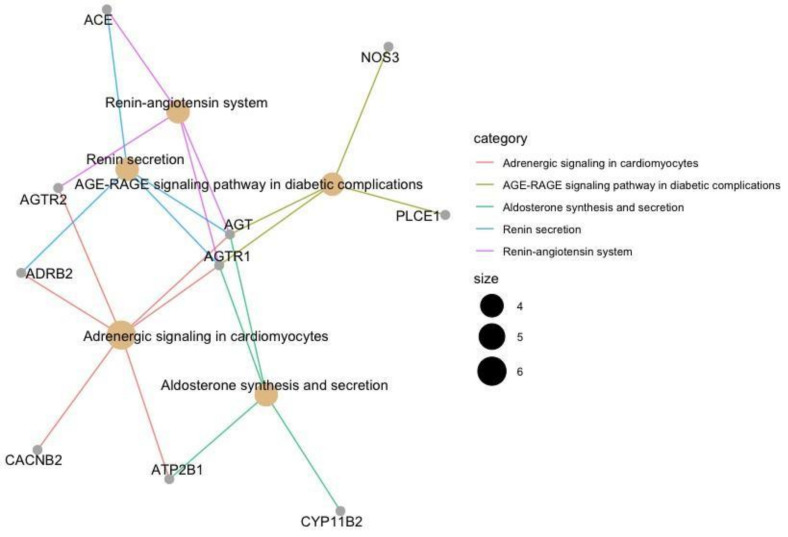
Figure 7.
Pathway enrichment analysis performed on the 53 HTN genes annotated using the KEGG database. Only 10 from the 53 HTN genes mapped to the KEGG database linking them to biological pathways. The plot illustrates the participating genes with the enriched pathway. Each enriched pathway has been color-coded, and the number of participating genes corresponds to the size of the node.

