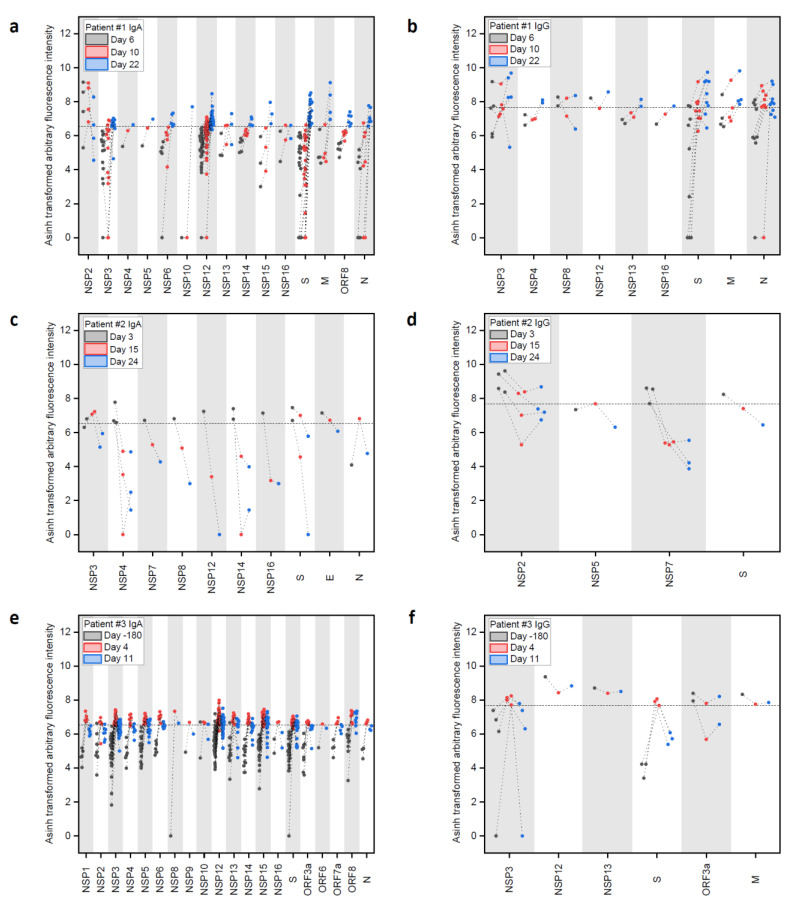
Figure 2.
Longitudinal IgA and IgG antibody response against peptide epitopes above threshold from SARS-CoV-2 proteome during COVID-19 disease progression in three patients. (a–f) Evolution of positive IgA and IgG responses against SARS-CoV-2 peptides at different time points after onset of disease in patients #1, #2, and #3. Data were generated with peptide microarrays containing the whole SARS-CoV-2 proteome as 4883 overlapping peptides. Fluorescence intensities were transformed with the inverse hyperbolic sine (asinh function). Threshold selection shown as dashed horizontal lines: 99.9th percentile of IgA/IgG signals in healthy control sample #3 d-180, IgA: 6.54 transformed arbitrary fluorescence units, and IgG: 7.68 transformed arbitrary fluorescence units. For full array data, see Supplementary Materials B.

