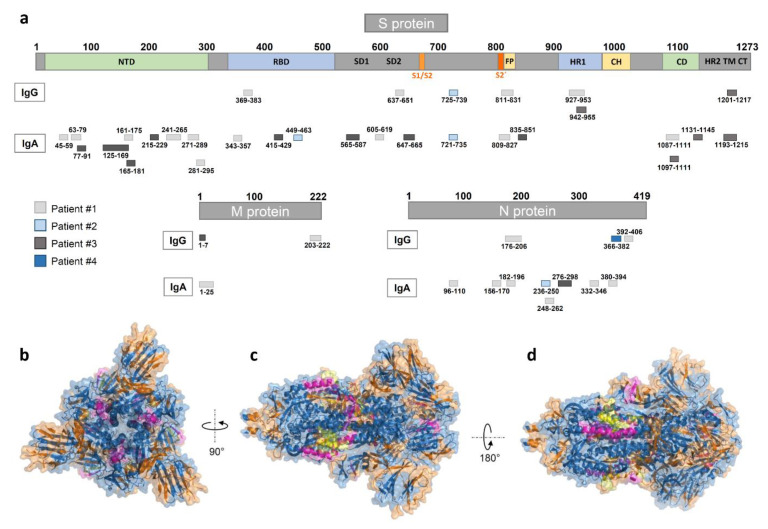
Figure 3.
Mapping of peptide microarray reactive antibodies on the S, M, and N-proteins. (a) IgG and IgA epitopes derived from all four patients on the S (domains from [15]), M, and N proteins (see Supplementary Materials A Table S3). (b–d) A 3D view of the S GP structure (in blue) with the herein identified IgA (highlighted in orange), IgG (highlighted in magenta), and overlapping (highlighted in yellow) epitopes derived from all nine SARS-CoV-2 patient samples (generated with PyMOL from Protein Data Bank file 6vxx—cryo-EM structure of S GP [16]). (b) Top view, (c) side view, and (d) alternate side view of S GP trimer.

