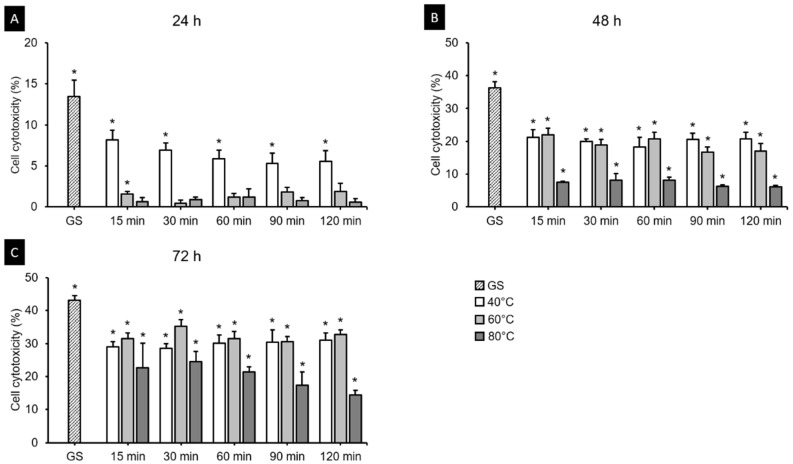
Figure 13.
Results from cell cytotoxicity assays after (A) 24 h, (B) 48 h and (C) 72 h. The cell cytotoxicity gradually increased with the cultivation time but decreased with the postcuring temperature. Mean and standard-deviation values are shown. Asterisk indicates a significant difference from the positive control (PC) in the t-test.

