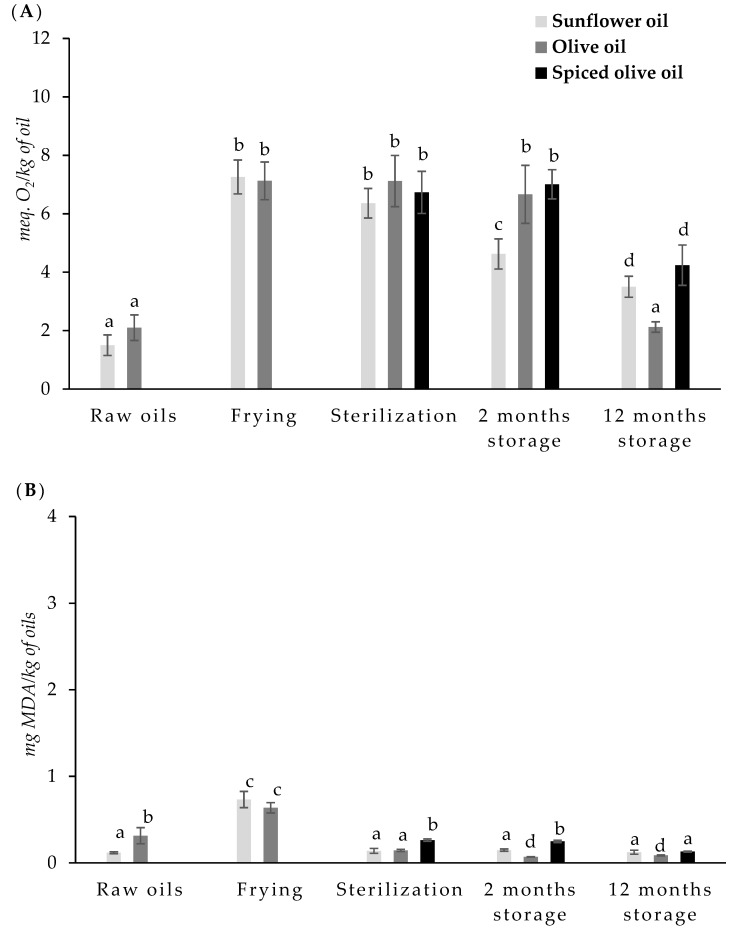
Figure 3.
Peroxide values (PVs) (meq. O2/kg of the sample) (A) and thiobarbituric acid reactive substances (TBARS) values (mg malonaldehyde/kg of the sample) (B) of oils in each step during the canning process and at 2 and 12 months of stored. a–d- Mean values with different letters are significantly different (p < 0.05).

