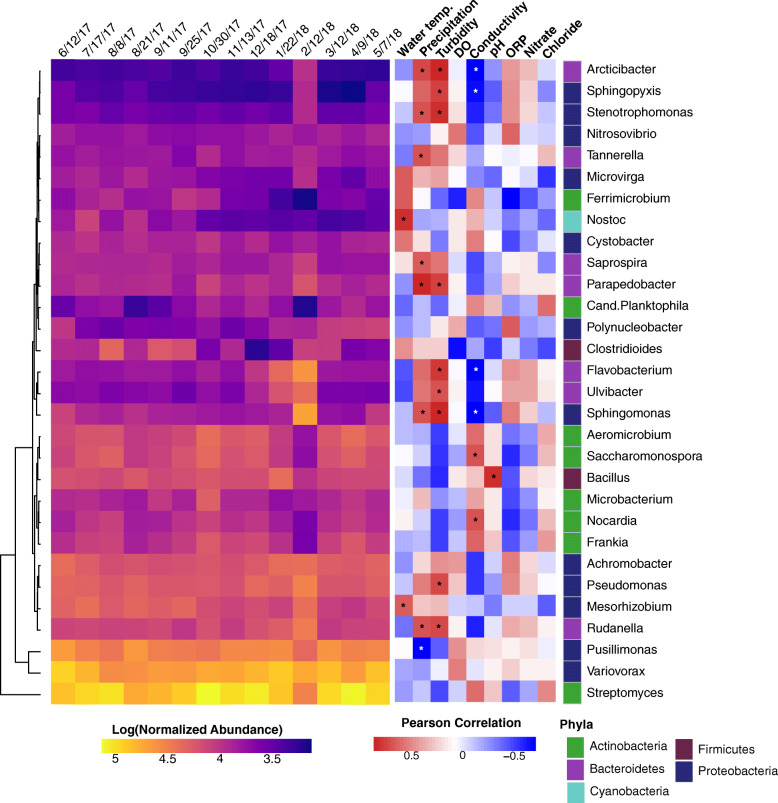
Fig. 3.
Bacterial genera and correlations with physicochemical factors in agricultural pond water across sampling dates. Heatmaps based on the log-transformed normalized abundance of the most dominant genera (> 1% in at least one sample) and the Pearson’s correlation coefficients between the water physicochemical factors and the bacterial genera normalized abundance listed on the Y-axis. Genera annotated with colors representative of their phylum (Proteobacteria: dark blue, Actinobacteria: green, Firmicutes: burgundy, Bacteriodetes: purple, Cyanobacteria: light blue). Hierarchical clustering of genera was performed using the complete clustering method with Euclidean distances on the bacterial abundances. Sampling dates ordered temporally. Asterix denote significant Pearson correlations (p ≤ 0.05) after FDR correction. Normalized abundance measured as contig coverage divided by the sum contig coverage per million

