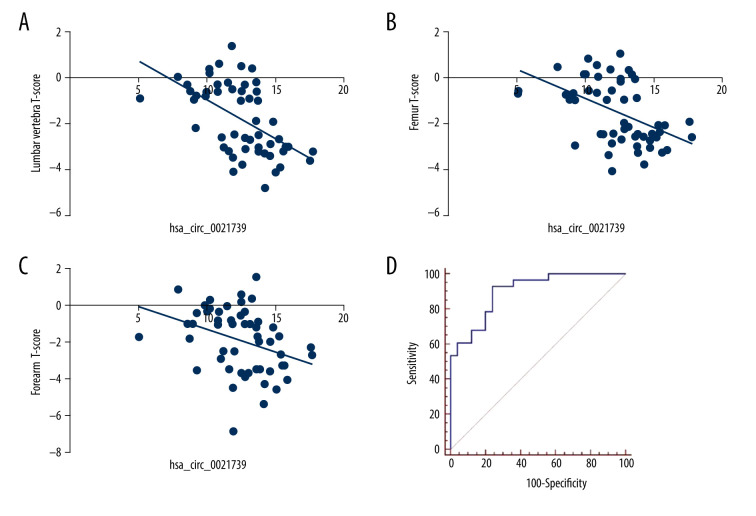
Figure 2.
Correlation between hsa_circ_0021739 expression and clinical characteristics of patients with postmenopausal osteoporosis (PMOP). (A–C) Correlation between hsa_circ_0021739 expression and T-scores for the lumbar vertebra, femur, and forearm. (D) Receiver-operating characteristic (ROC) curve for hsa_circ_0021739 expression in peripheral blood mononuclear cells (PBMCs) of PMOP patients (area under the curve [AUC]: 0.849, confidence interval [CI]: 0.724–0.932, P<0.001).

