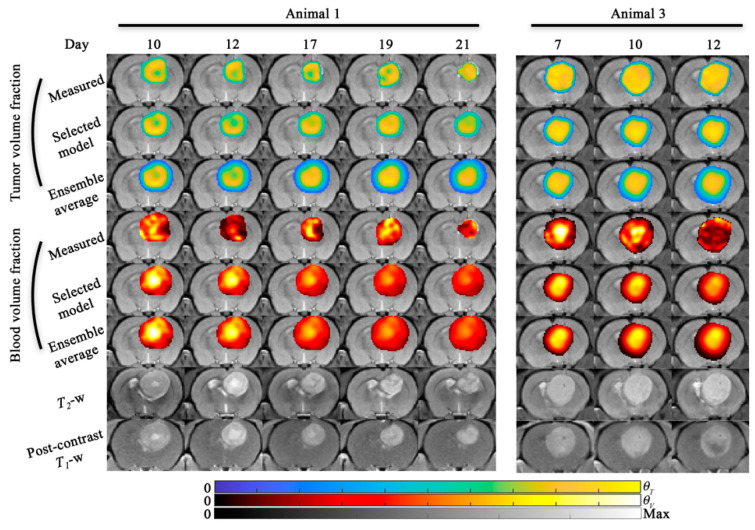
Figure 6.
Model predictions (scenario 2) for animal 1 and 3. Model predictions of tumor and blood volume fractions at the central slice are shown for animal 1 and animal 3. For both animals, the model predictions from the selected model and the ensemble average are shown. The bottom two rows show the T2-weighted and post-contrast T1-weighted MRI. For animal 1, both the selected and ensemble average model predict the areas of intratumor heterogeneity in the tumor volume predictions. Blood volume predictions tended to predict increased blood volume in the interior of the tumor relative to the periphery as observed. For animal 3, the observed tumor is more homogeneous (compared to animal 1) and the model is able to predict this distribution. Additional, both models predict a higher blood volume fraction towards the interior of the tumor at the final time point which is not present in the measured blood volume fraction. For animal 1, tumor growth was predicted from day 10 to 21 and resulted in −1.0% and 261% error in tumor volume predictions for the selected and ensemble models, respectively. For animal 3, both the selected and ensemble average model resulted in <4.6% error in tumor volume predictions. A sagittal view of this figure is shown in Figure S1.

