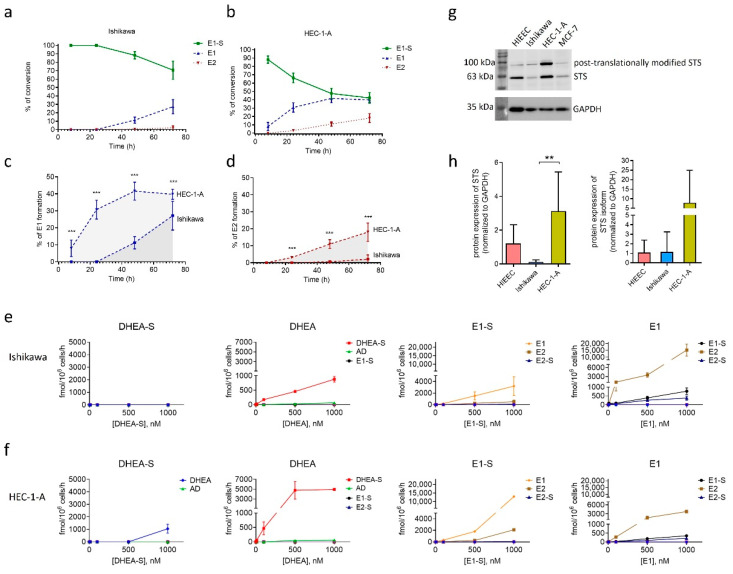
Figure 3.
Metabolism of E1-S by Ishikawa and HEC-1-A cell lines evaluated using HPLC and LC-HRMS. Formation of metabolites E1 and E2 by Ishikawa (a) and HEC-1-A cells (b) after incubation with 16 nM [3H]E1-S was evaluated by HPLC. The levels of individual metabolites formed after 8 h, 24 h, 48 h and 72 h are shown as percentages (%) of total products. Comparison of E1-S metabolism to E1 (c) and E2 (d) in HEC-1-A compared to Ishikawa. Three independent experiments (Mann–Whitney U test). (e,f) Formation of metabolites (AD, DHEA, DHEA-S, E1, E1-S, E2 and E2-S) was evaluated by LC-HRMS in medium of Ishikawa and HEC-1-A cells 48 h after addition of 10, 100, 500 or 1000 nM DHEA-S, DHEA, E1-S or E1 in two replicates for individual treatment. (g) STS protein levels in HIEEC, Ishikawa, HEC-1-A and a positive control MCF-7. Cropped sections of one representative membrane are shown. The full-length coomassie-stained gels, Ponceau S-stained membranes, full-length membranes after chemiluminescent detection of STS and GAPDH, and densitometric readings are presented in Supplementary File, Figure S1. (h) STS levels in cell lines HIEEC, Ishikawa and HEC-1-A. GAPDH was used as a loading control. The levels of STS were determined in four independently isolated protein samples from four cell lines. Western blot was repeated independently two times. The levels of STS in each sample were normalized to its loading control. One-way ANOVA with Bonferroni’s Multiple Comparison test was used to determine statistical significance. Data are shown as mean ± SD. ** p-value ≤ 0.01, *** p-value ≤ 0.001.

