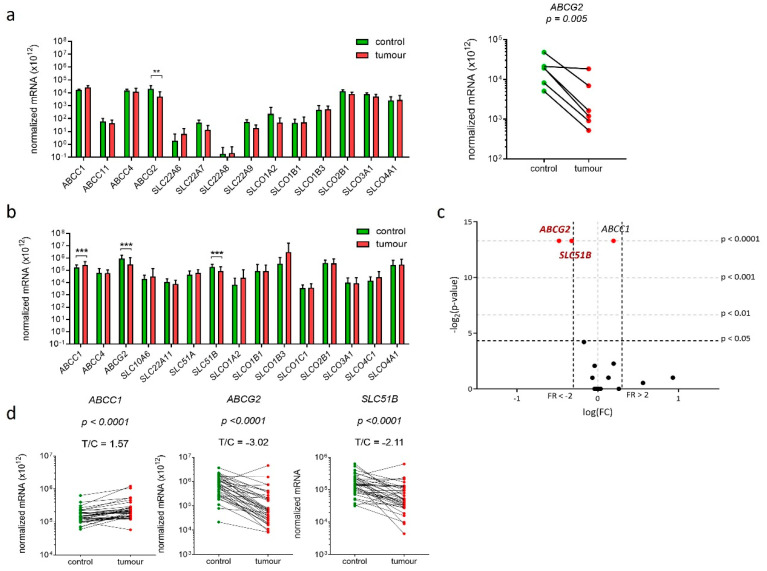
Figure 4.
Expression of genes encoding E1-S transporters in 36 paired samples of EC and adjacent control tissue. (a) Normalized mRNA expression level of 14 genes encoding E1-S transporters (Human Drug transporters PCR Array PAHS-070Z) in 6 paired tissue samples (Wilcoxon matched pairs with Bonferroni’s multiple comparison). (b) Normalized mRNA expression analysis of 15 genes encoding E1-S transporters in 36 paired tissue samples (Wilcoxon matched pairs with Bonferroni’s multiple comparison tests) in EC compared to control tissue. (c) Volcano plot shows the most significantly down-regulated and the most significantly up-regulated genes. (d) Before-and-after graphs show the normalized mRNA levels for genes ABCC1, ABCG2 and SLC51B in 36 paired tissue samples. Data are shown as a mean ± SD on the logarithmic scale. ** p-value ≤ 0.01, *** p-value ≤ 0.001.

