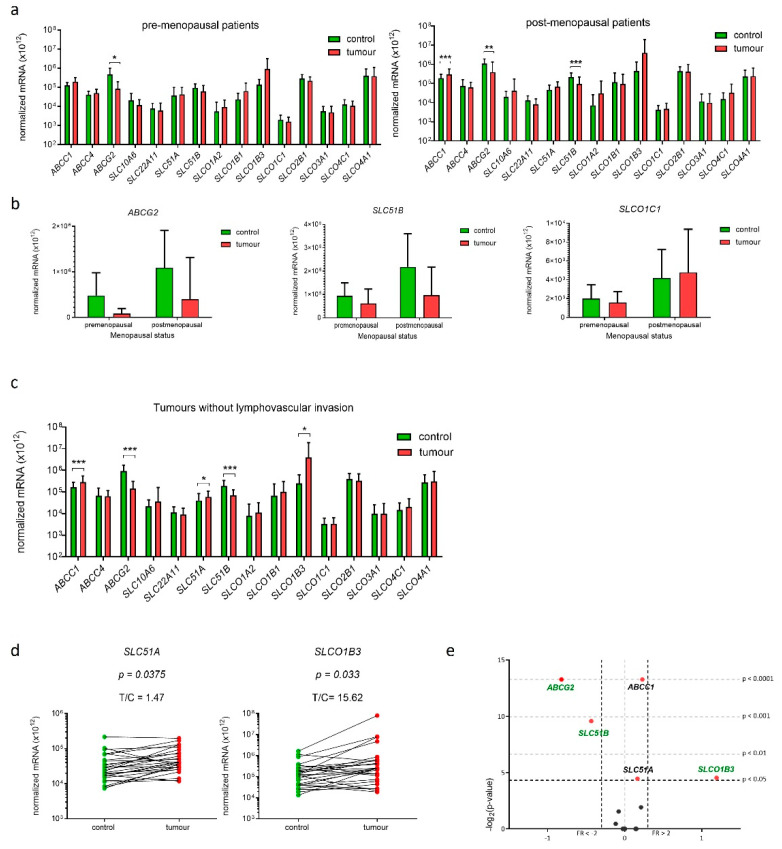
Figure 5.
Expression of genes encoding E1-S transporters in paired tissue samples from premenopausal and postmenopausal patients and patients without lymphovascular invasion. (a) Expression in tissue samples from premenopausal patients (n = 11) and tissue samples from postmenopausal patients (n = 25). (Wilcoxon matched pairs with Bonferroni‘s multiple comparison test). (b) Effects of menopausal status on expression of three genes: ABCG2, SLC51B and SLCO1C1 (two-way ANOVA). (c) Expression of genes in samples from patients without lymphovascular invasion (n = 27) (Wilcoxon matched pair tests with Bonferroni multiple comparison correction). (d) Before-and-after graphs show the normalized mRNA levels of SLC51A and SLCO1B3 in 27 paired tissue samples. (e) Volcano plot shows fold change (FC) of normalized mRNA levels in tumours vs. controls. Data are shown as mean ± SD, * p-value ≤ 0.05, ** p-value ≤ 0.01, *** p-value ≤ 0.001.

