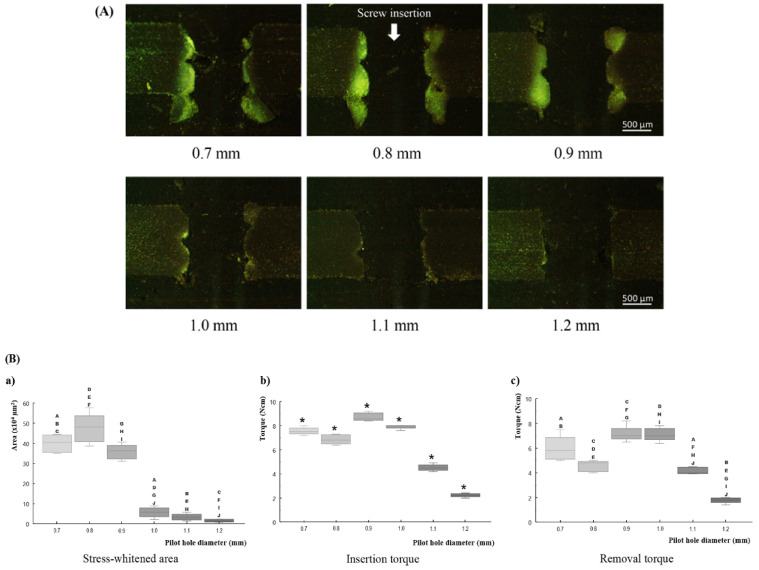
Figure 4.
Results of miniscrew insertion test. (A) light microscopic images of the tested bone pieces in cross-sectional view (Bar = 500 µm), (B) box-plot graphs showing median values. (a) stress-whitened area, (b) maximum insertion torque, and (c) maximum removal torque. The asterisk represents significant differences among all groups (p < 0.05). A–J in graph (a,c) indicate significant differences (p < 0.05) between respective pairs of plots.

