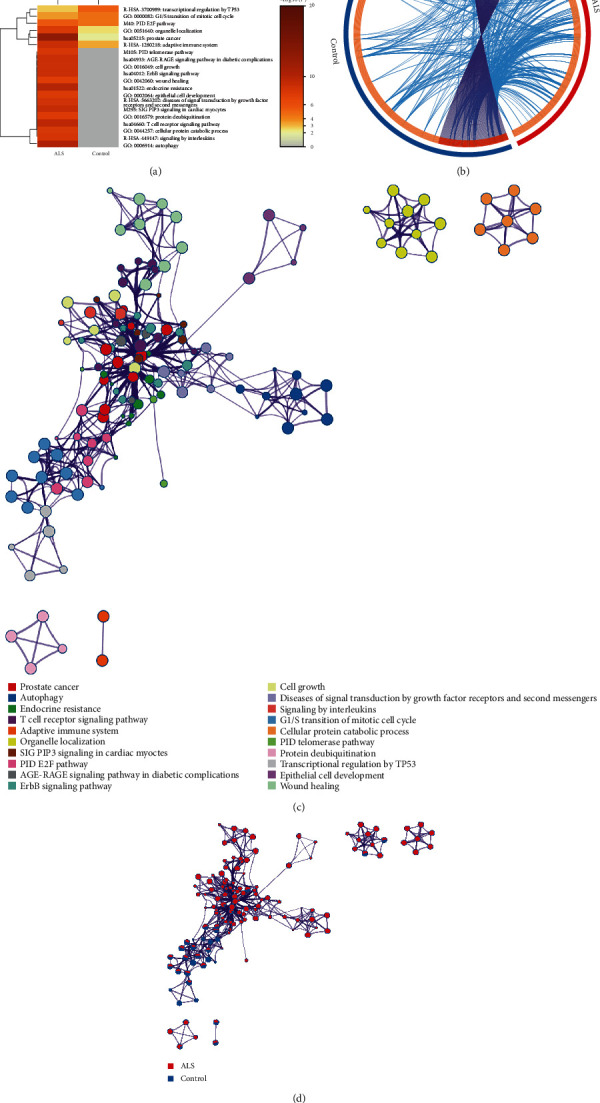
Figure 3.

ceRNA network function annotation. (a) Biological processes associated with genes in the ceRNA network in ALS cases and control cases. (b) Comparison of 493 genes between ALS cases and control cases in the ceRNA network. The red/blue/light orange/dark orange colour represents ALS group genes/controls genes/differentially expressed genes/common genes, respectively. (c) Further analysis of the relationship among top 20 GO terms. (d) Most terms were enriched in different categories in the ALS group.
