Figure 5.

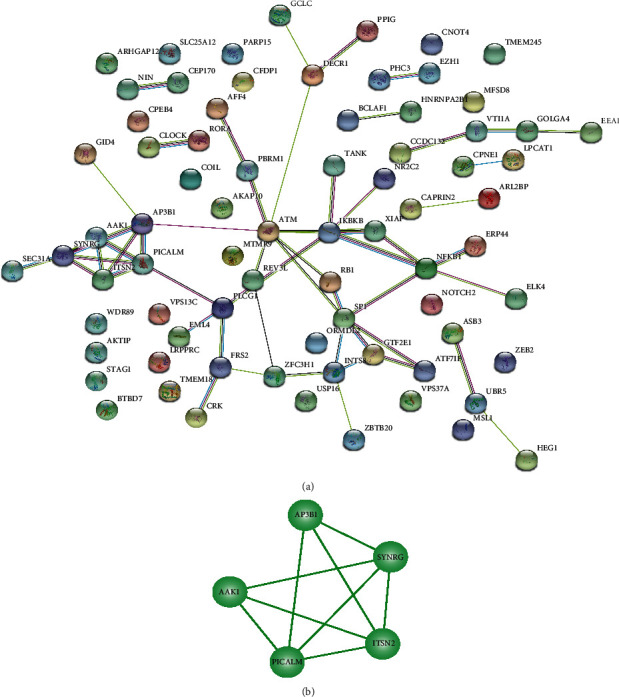
PPI network: (a) the red and green nodes represent the upregulated and downregulated genes, respectively; (b) modules formed by SYNRG, ITSN2, AAK1, PICALM, and AP3B1 in the PPI network.

PPI network: (a) the red and green nodes represent the upregulated and downregulated genes, respectively; (b) modules formed by SYNRG, ITSN2, AAK1, PICALM, and AP3B1 in the PPI network.