
Figure 5.
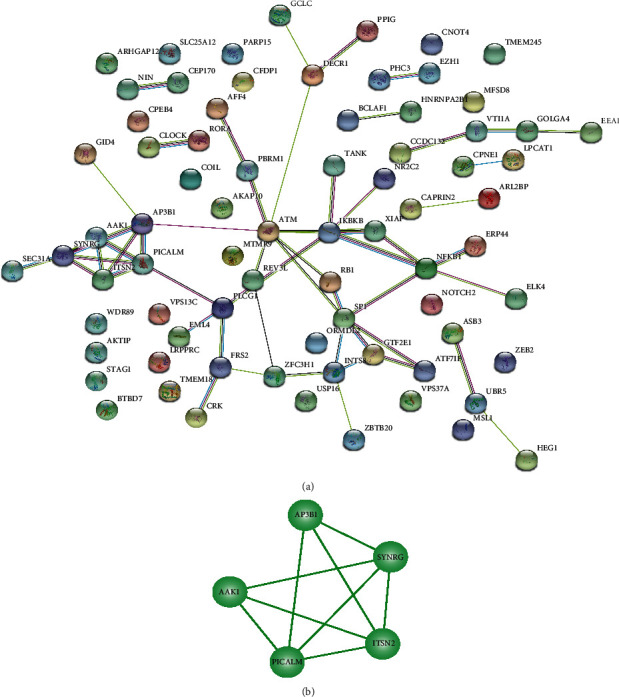
PPI network: (a) the red and green nodes represent the upregulated and downregulated genes, respectively; (b) modules formed by SYNRG, ITSN2, AAK1, PICALM, and AP3B1 in the PPI network.
Official websites use .gov
A
.gov website belongs to an official
government organization in the United States.
Secure .gov websites use HTTPS
A lock (
) or https:// means you've safely
connected to the .gov website. Share sensitive
information only on official, secure websites.
PPI network: (a) the red and green nodes represent the upregulated and downregulated genes, respectively; (b) modules formed by SYNRG, ITSN2, AAK1, PICALM, and AP3B1 in the PPI network.