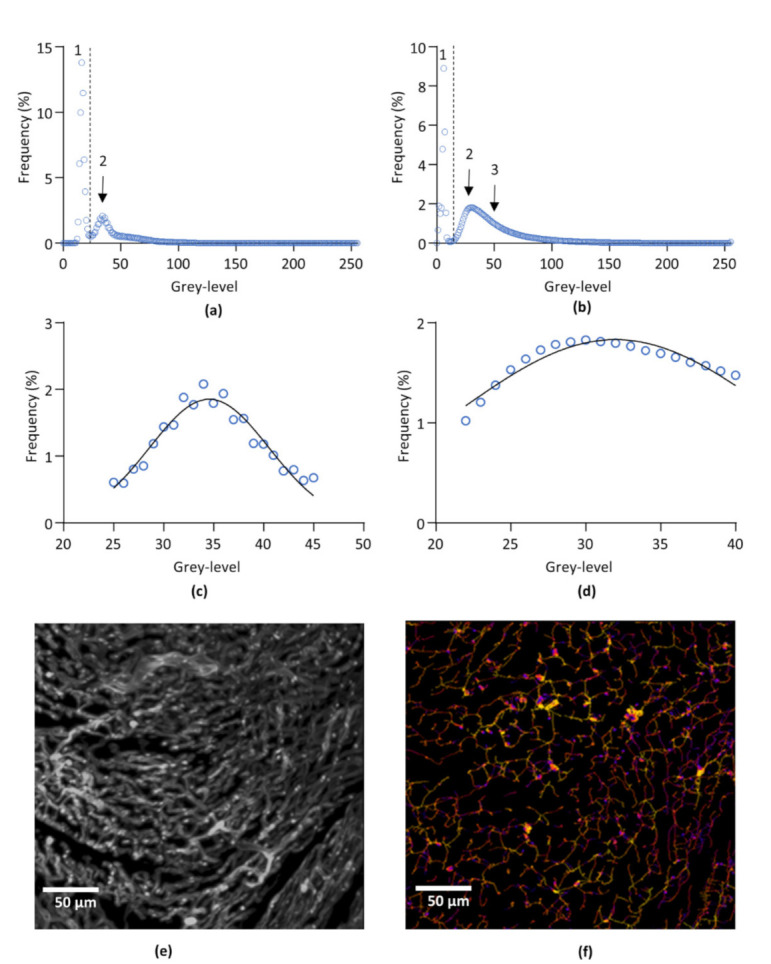
Figure 1.

Image processing. (a,b) Representative frequency distribution of pixel population of non-labelled (negative control) (a) and lectin-labelled (b) left ventricle after 3D imaging by light sheet microscopy. 1: background. 2: non-labelled cardiac tissue. 3: lectin-labelled capillary network. (c), Gaussian fit of the subset of pixels corresponding to the cardiac tissue from curve (a). (d), Gaussian fit of the subset of pixels corresponding to the cardiac tissue from curve (b). (e), Representative segmented image of left ventricle capillary network. The image was obtained by overlaying the original capillaries image and the binarized image of the capillaries obtain after segmentation. (f), Skeletonization and image mapping of the capillary network of (e). Average radii of each segment are encoded in false colors from blue to red. The image was obtained by overlaying the skeleton and the distance map images of the capillary network.
