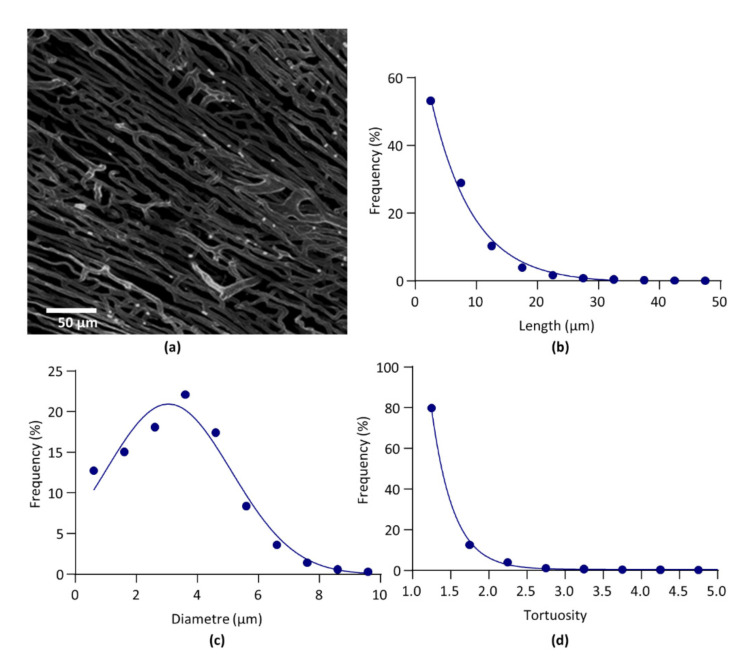
Figure 4.
Confocal microscopy. (a). Segmented image of left ventricle capillary network. (b). Relative frequency distribution of segment length. Data were fitted by one-phase exponential decay. (c). Relative frequency distribution of segment diameter. Data were fitted by Gaussian equation. (d). Relative frequency distribution of segment tortuosity. Data were fitted by one-phase exponential decay.

