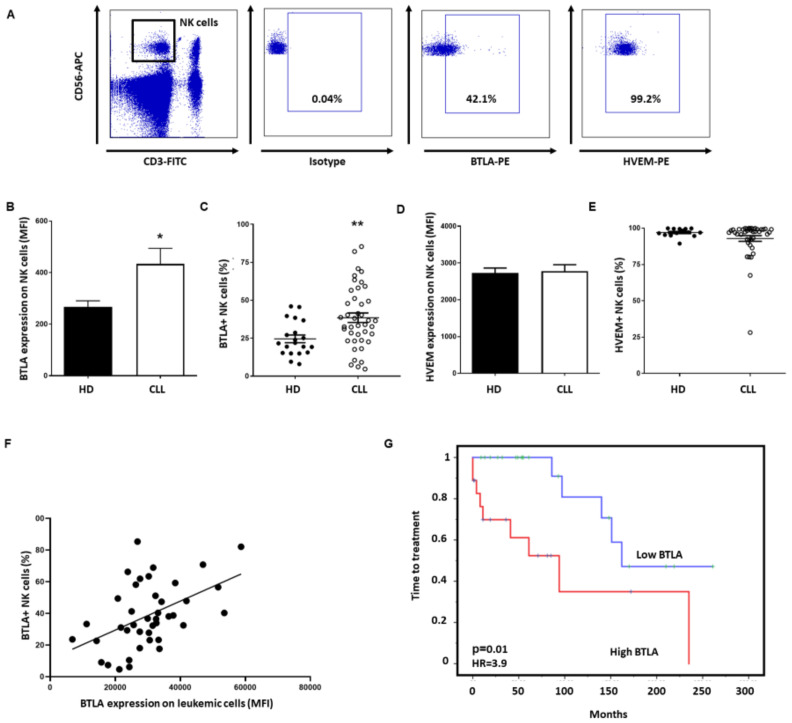
Figure 5.
BTLA expression is increased on NK cells and impacts time to treatment. (A) Dot plot showing the gating strategy for NK cell identification and evaluation of BTLA+ and HVEM+ populations. (B) Comparison of BTLA surface expression between patients with CLL (n = 42) and HD (n = 20) (MFI ± SEM). (C) Percentage of BTLA+ NK cells in patients with CLL compared to HD. (D,E) HVEM surface expression (D) and the percentage of HVEM+ NK cells (E) in patients with CLL compared to HD. (F) Correlation between the percentage of NK cells expressing BTLA and its expression on leukemic cells (p = 0.0015). (G) Kaplan–Meier survival analysis showing TTT in patients with CLL categorized by BTLA levels. * p < 0.05, ** p < 0.01.

