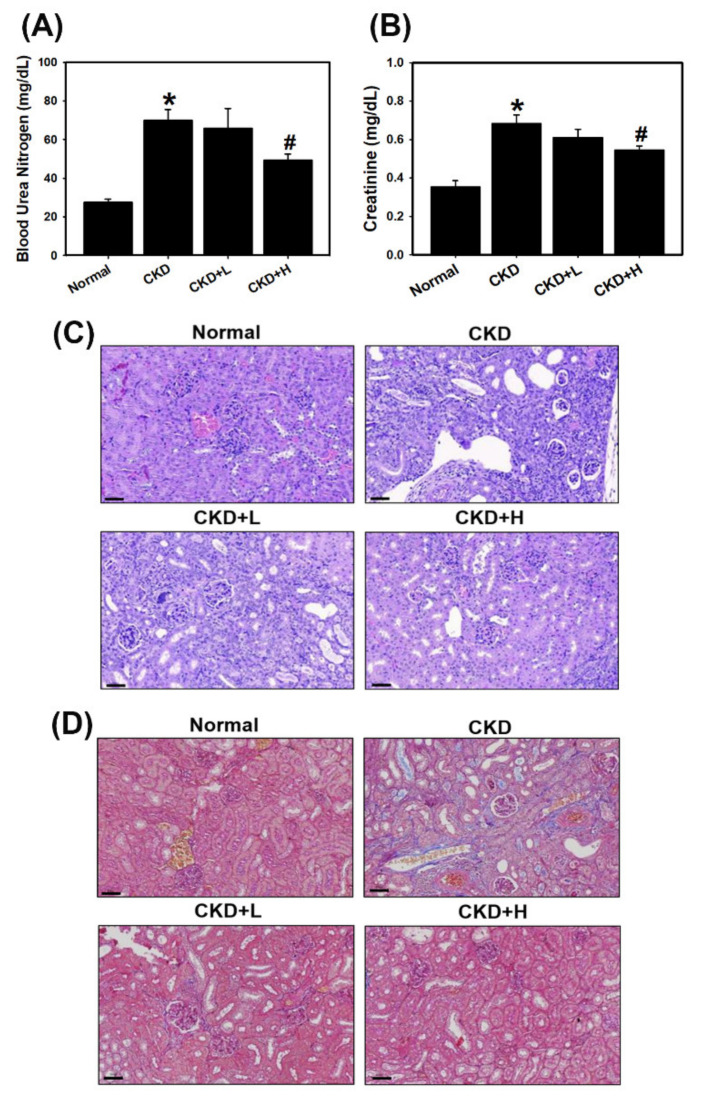
Figure 5.
Biochemical and histopathological analyses of a mouse model of adenine diet-induced CKD. Renal function was evaluated by analyzing blood urea nitrogen (BUN) (A) and creatinine (B) levels (five mice per group). * p < 0.05 compared with the normal group. # p < 0.05 compared with the CKD group. Data are presented as the means ± standard deviation. Representative micrographs of H&E (C) and Masson’s trichrome (D) staining in the indicated groups in the adenine diet-induced CKD model. Scale bar = 60 µm.

