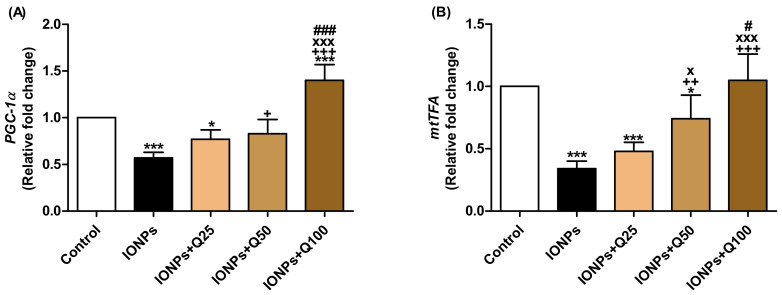
Figure 5.
mRNA relative fold change expression of brain tissue. (A) PGC-1α. (B) mtTFA. Data were analyzed with a one-way ANOVA followed by Tukey’s multiple comparison test. * p < 0.05 and *** p < 0.001 vs. the control. ++ p < 0.01 and +++ p < 0.001 vs. IONPs. x p < 0.05 and xxx p < 0.001 vs. IONPs + Q25. # p < 0.05 and ### p < 0.001 vs. IONPs + Q25. Error bars represent mean ± SD. n = 5. White color column refers to control. Black color column refers to IONPs. Colored column with different extents refers to different concentrations of quercetin supplementations to IONPs-treated groups.

