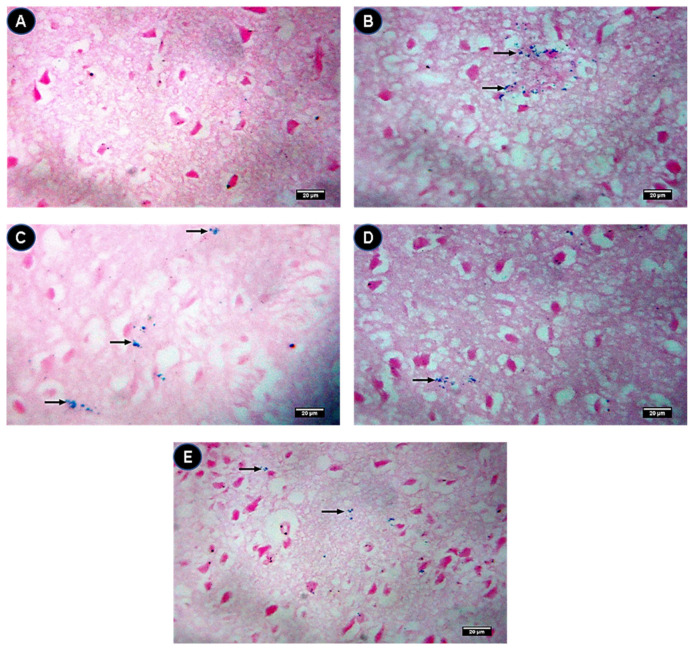
Figure 7.
Brain tissue stained with Prussian blue (Black arrows). (A) Control group showing a negative Prussian blue stain. (B) IONPs group showing blue spots representing the iron contents by Prussian blue stain. (C) IONPs + Q25 group showing moderate blue spots representing the iron contents by Prussian blue stain. (D) IONPs + Q50 group showing a few blue spots representing the iron contents by Prussian blue stain. (E) IONPs + Q100 group showing very few dispersed blue spots representing the iron contents by Prussian blue stain. ×400. Scale bar = 20 µm.

