Scheme 1.
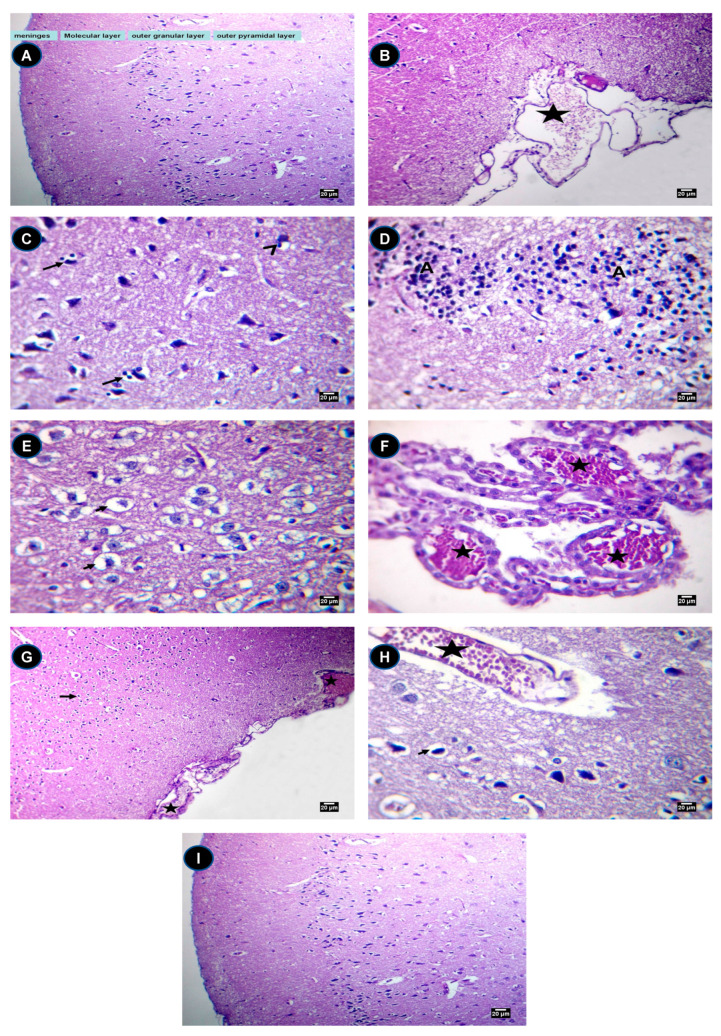
Histopathology assessment. (A) The brain of a rat showing the normal histological structure of the meninges and cerebrum cortex, H and E (×200). (B) The meninges of a rat treated with IONPs showing the congestion of the submeningeal blood vessels (star), H and E (×200). (C) The cerebrum of a rat treated with IONPs showing satellitosis (arrows) and neuronophagia (arrowhead), H and E (×400). (D) The cerebrum of a rat treated with IONPs showing gliosis (A), H and E (×400). (E) The cerebrum of a rat treated with IONPs showing spongiosis (short arrows), H and E (×400). (F) The choroid plexus of a rat treated with IONPs showing severe congestion (stars), H and E (×400). (G) The brain of a rat in the IONPs + Q25 group showing spongiosis (short arrows) and the congestion of the submeningeal blood vessels (stars), H and E (×200). (H) The cerebrum of a rat in the IONPs + Q50 group showing mild spongiosis (short arrows) and the congestion of blood vessels (star), H and E (×400). (I) The brain of a rat in the IONPs + Q100 group showing a relatively normal histological structure of the meninges and cerebrum cortex, H and E (×200). Scale bar = 20 µm.

